
I will be the first to admit that I never expected to see Oil trading anywhere near as low as it has gotten. I thought Oil was a steal at $50 and it continued to fall another 50% lower. Lately the correlation between Oil and stocks has been high. So going forward the question is has Oil finally hit bottom?
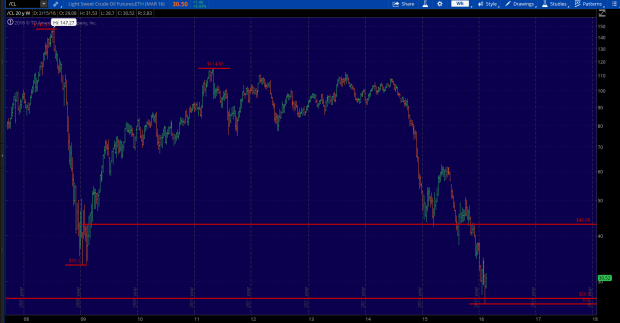
One technical observation that suggests risk levels are low enough that perhaps a bottom can be formed, is the size of the decline in Oil from its highs has now matched the size of the 2008 crash.
In 2008 Oil proceeded to fall from a high of $147 to a low of $33, which equates to a drop of 77% (the term “crash” is well overused these days, this is a legitimate “crash”). We fast forward to find that the drop from the 2011, 2012, 2013 highs around $114, down to last weeks low at $26 has entered the similar 77% decline area also.
So there is reason to believe Oil has or is nearing a bottom here, after all how much lower can it possibly go.
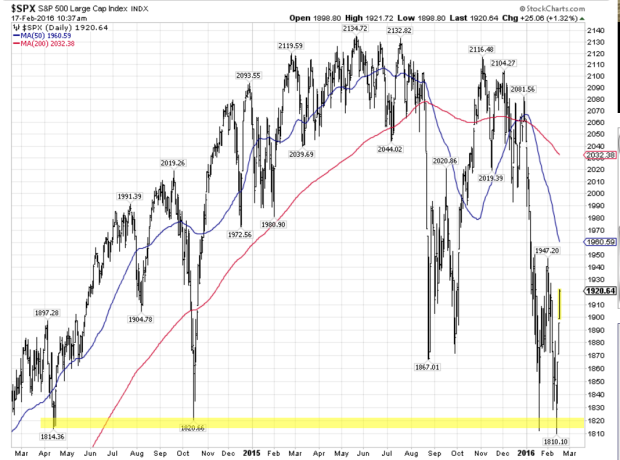
As for stocks, last week the S&P 500 average retested and held the support zone between 1815-1820. The proceeding rally has been quite fast and welcome after the difficult start to the year. Global markets still have an uphill battle to overcome in the short term but the longer term technical uptrend still remains intact. Global central banks continue to express accommodative support and recession odds are quite low.
If Oil can stabilize and corporate profit growth picks back up again (projected to pick up in 2nd half of 2016) than there is a very good chance for this bull market to continue.
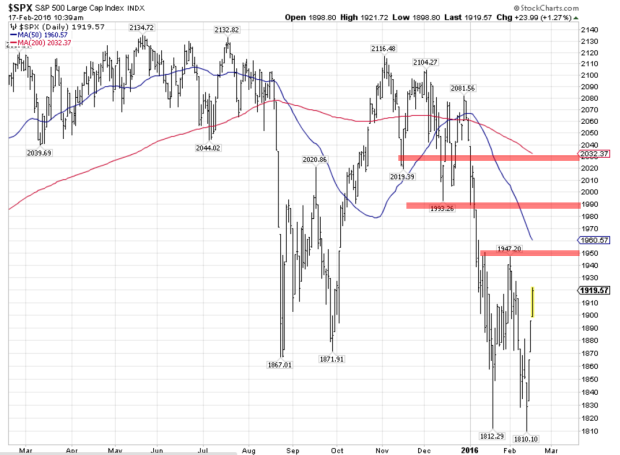
In the short term, resistance on the S&P 500 comes around 1947 (the top of prior range), 1990 and 2020.
I still feel its too soon to tell if last weeks low will end this correction. However if price can move above 1990 on the S&P 500 then I think there is a very good chance that the correction is indeed over.


Leave A Comment