
In this past weekend’s newsletter, I covered the current technical position of oil/energy related investments and the recent bear market rally. The latter is most relevant to today’s discussion on bonds.
“As I have stated before, when the market re-establishes a positive trend, I will recommend putting preserved capital back to work. However, for such an equity increase to be warranted, the market will need to break the current declining price trend and work off some of the currently extreme overbought conditions. This is shown in the updated chart from last week.”
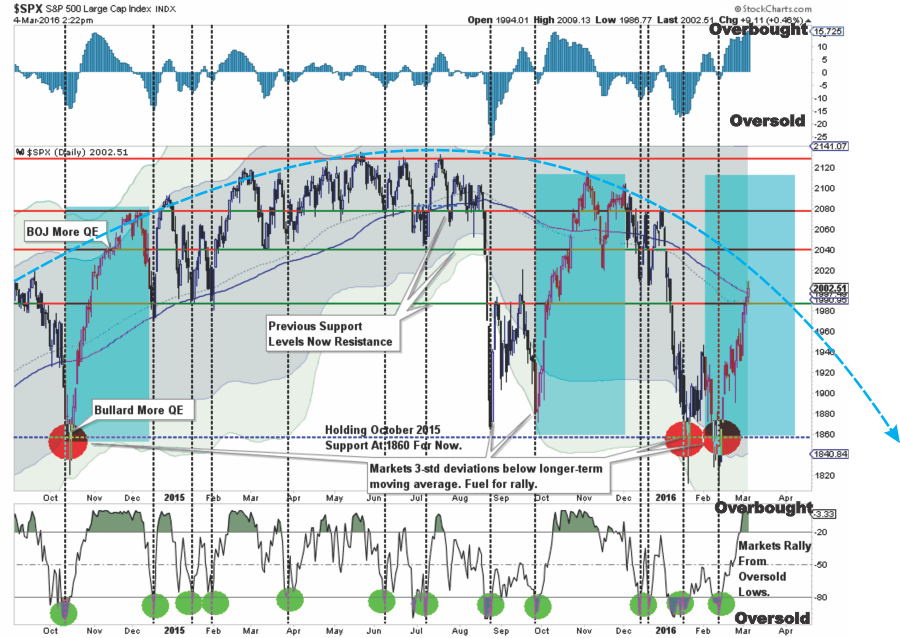
“There are quite a few moving pieces here, so let me explain.
-
The shaded areas represent 2 and 3-standard deviations of price movement from the 125-day moving average. I am using a longer-term moving average here to represent more extreme price extensions of the index. The last 4-times prices were 3-standard deviations below the moving average, the subsequent rallies were very sharp as short positions were forced to cover.
- The top and bottom of the chart show the overbought/sold conditions of the market. The recent rally has responded as expected from recent oversold conditions. With the oversold condition now exhausted, the potential for further upside has been greatly reduced.
- The easiest path for prices continues to be lower as downward resistance continues to be built. The arching dashed blue line shows the change of overall advancing to now declining price trends.
The last sentence above is the most important. The signal to increase equity related exposure in portfolios will require a breakout above the currently negative price trend. Until that happens, we remain confined in a ‘bear’market.”
With the markets now struggling to gain ground as the “first of the month” buying frenzy begins to fade, the question is now whether the next decline retests, or breaks, recent lows OR establishes a higher bottom to begin building a more bullish case from.


Leave A Comment