A funny thing often occurs after a mania-fueled asset bubble pops: an echo-bubble inflates a few years later, as monetary authorities and all the institutions that depend on rising asset valuations go all-in to reflate the crushed asset class.
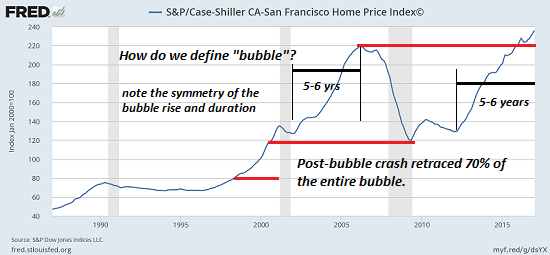
Take a quick look at the Case-Shiller Home Price Index charts for San Francisco, Seattle and Portland, OR. Each now exceeds its previous Housing Bubble #1 peak:


Is an asset bubble merely in the eye of the beholder? This is what the multitudes of monetary authorities (central banks, realty industry analysts, etc.) are claiming: there’s no bubble here, just a “normal market” in action.
This self-serving justification–a bubble isn’t a bubble because we need soaring asset prices–ignores the tell-tale characteristics of bubbles. Even a cursory glance at these charts reveals various characteristics of bubbles: a steep, sustained lift-off, a defined peak, a sharp decline that retraces much or all of the bubble’s rise, and a symmetrical duration of the time needed to inflate and deflate the bubble extremes.
It seems housing bubbles take about 5 to 6 years to reach their bubble peaks, and about half that time to retrace much or all of the gains.
Bubbles have a habit of overshooting on the downside when they finally burst. The Federal Reserve acted quickly in 2009-10 to re-inflate the housing bubble by lowering interest rates to near-zero and buying over $1 trillion of mortgage-backed securities.
When bubbles are followed by echo-bubbles, the bursting of the second bubble tends to signal the end of the speculative cycle in that asset class. There is no fundamental reason why housing could not round-trip to levels below the 2011 post-bubble #1 trough.
Consider the fundamentals of China’s remarkable housing bubble. The consensus view is: sure, China’s housing prices could fall modestly, but since Chinese households buy homes with cash or large down payments, this decline won’t trigger a banking crisis like America’s housing bubble did in 2008.


Leave A Comment