Dividend growth investing is an actionable, repeatable way to build wealth over the long term.
One of the most common goals of the dividend investor is to create a large enough dividend income stream to comfortably retire.
This begs the question – exactly how much money does one need to retire? How much should be contributed each year to reach this sum? How much more should be contributed if one wants to retire X years early?
On the surface, these questions might seem impossible to answer. Each question contains so many variables that they are difficult to answer with any certainty.
However, that does not stop an investor from making informed estimations. With the right data and proper tools, investors can make reasonable predictions about future retirement scenarios.
More importantly, they can use these predictions to make adjustments if they are not on track to meet their goals.
This article will provide a useful tool to aid in retirement planning and discuss some of the qualitative and quantitative aspects of retirement forecasting that are within investors’ control.
Introducing the Sure Dividend Retirement Calculator
The tool that will be introduced in this article was designed to help investors calculate the expected value of their retirement portfolio when provided with certain personalized variables.
The most rigorous way to do this is by using a Monte Carlo simulator. This is a statistical technique that runs multiple simulation of future investment returns based on previous stock market behavior.
With the right software, an investor can run 10, 100, or even 1000 simulations, giving them a range of expectations for the future value of their retirement portfolio.
The Sure Dividend Retirement Calculator is a 100-simulation Monte Carlo program that bases its expected returns on the behavior of the Vanguard Dividend Appreciation ETF (VIG) since the fund’s inception in 2006. With its focus on dividend stocks, VIG was selected as a reasonable benchmark for Sure Dividend readers.
You can access the Sure Dividend Retirement Calculator at the following link: Click Here to see the retirement calculator now
Like any other statistical calculator, the Sure Dividend Retirement Calculator makes various assumptions that may or may not be realistic depending on market behaviors.
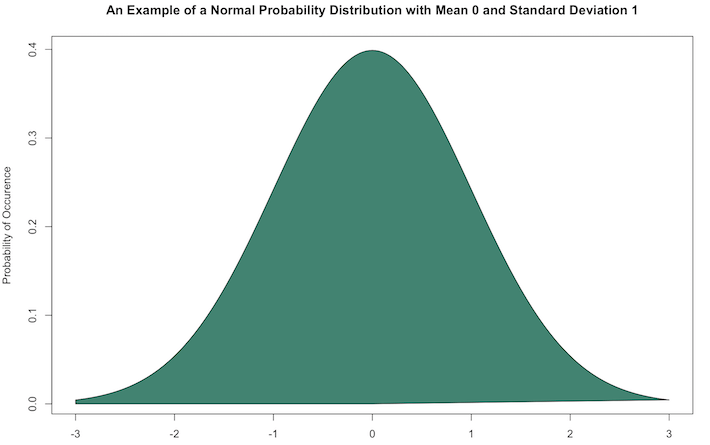
One of the most notable is the assumption that stock market returns are normally distributed. This is statistical language that says that the stock market behaves according to a particular mathematical distribution.
Namely, saying that returns are normally distributed implies that they are centered around some mean with a bell-curve shape, like this:

?
In reality, the probability distribution of stock market returns is much more skewed towards the tails of the above graph. In other words, extremely outliers are observed more often in stock market returns than would be expected from looking at the chart above.
An example of this can be seen in the following illustration.

?
Source: JP Morgan Asset Management
While the observed (or empirical) stock market returns have a higher center points than the corresponding normal distribution, this is offset by a ‘fat’ left tail due to a higher-than-predicted number of extremely negative occurrences.
That being said, the normal distribution is commonly accepted proxy for stock market returns. The Sure Dividend Retirement Calculator makes use of a normal distribution based on the historical data available from VIG.


Leave A Comment