
You just bought a house. If you’re like most Americans, it will soon become the largest component of your net worth, and only increase as a percentage over time. Naturally, you would like to see it go up. But by how much?
Predicting future home prices is a difficult a game, made complicated by the myriad of factors influencing the housing market, including: the supply/demand for housing, affordability, inflation, economic/wage growth, availability of credit, mortgage rates, unemployment, demographics, location, etc., etc.
If a homeowner can’t predict such things, what can they reasonably expect in terms of appreciation over time?
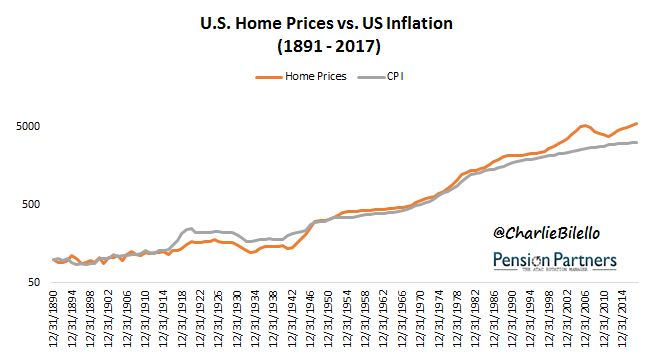
A good starting point is the rate of inflation (CPI), which national home prices have tracked relatively closely over long periods of time.
Data Sources for all charts/tables herein: S&P/Case Shiller, BLS
From 1891 through 1996, national home prices only exceeded inflation by 15% on a cumulative basis, and few considered housing “an investment.”
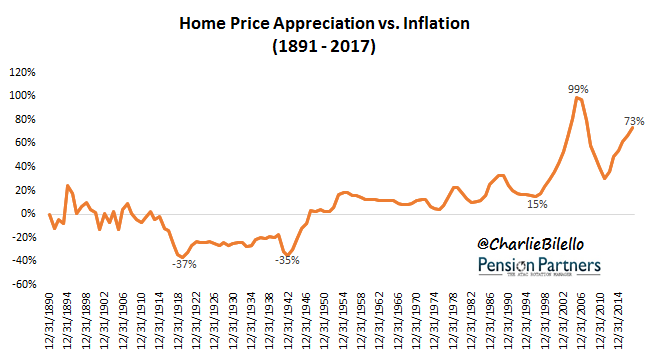
That thinking changed during the housing bubble when prices would exceed the inflation rate by a wide margin (76% from 1997-2005), leading many to believe that housing was the new-and-improved stock market, better because it “never went down.”
And then, of course, it went down, falling every year from 2007 through 2011. Since then, home prices have recovered all of their losses on a nominal basis, but remain below their inflation-adjusted peak in 2006.

What does any of this tell us about future home prices?
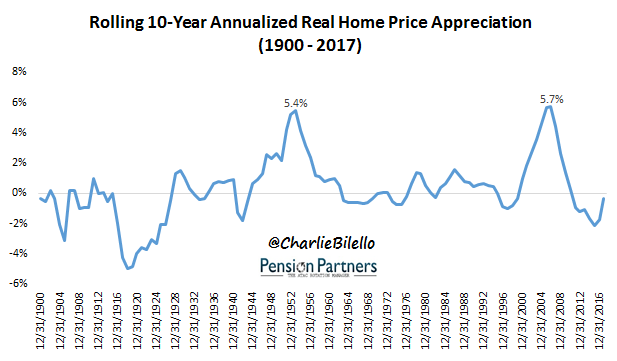
Not much in the short-run, as the table above clearly indicates. Anything can happen in any given year or any given five-year year period for that matter. But for homeowners who plan to be in their house for 30 years or more, what they’ll most likely find is an appreciation rate that doesn’t deviate that much from the rate of inflation. In the best 30 years for the housing market (1976-2005), real price appreciation averaged 2.2% per year. In the worst 30 years for housing (1895-1924), real price appreciation averaged -2.1% per year.


Leave A Comment