The MOTIF structure simply serves as a starting framework to build other mental models and practices off of. It helps ensure that you’re trading with the larger trends and macro forces currently at work. This is extremely important. As traders, we want as many tailwinds behind our trades as possible.
Let’s go through a recent trade example to see how we identified a trade setup using the four steps below.
Remember: keep it simple stupid. To identify the macro environment all you need to do is:
We’ll start with the broader market and then work down to the individual equity level in order to establish the direction of cyclical and intermediate trends.
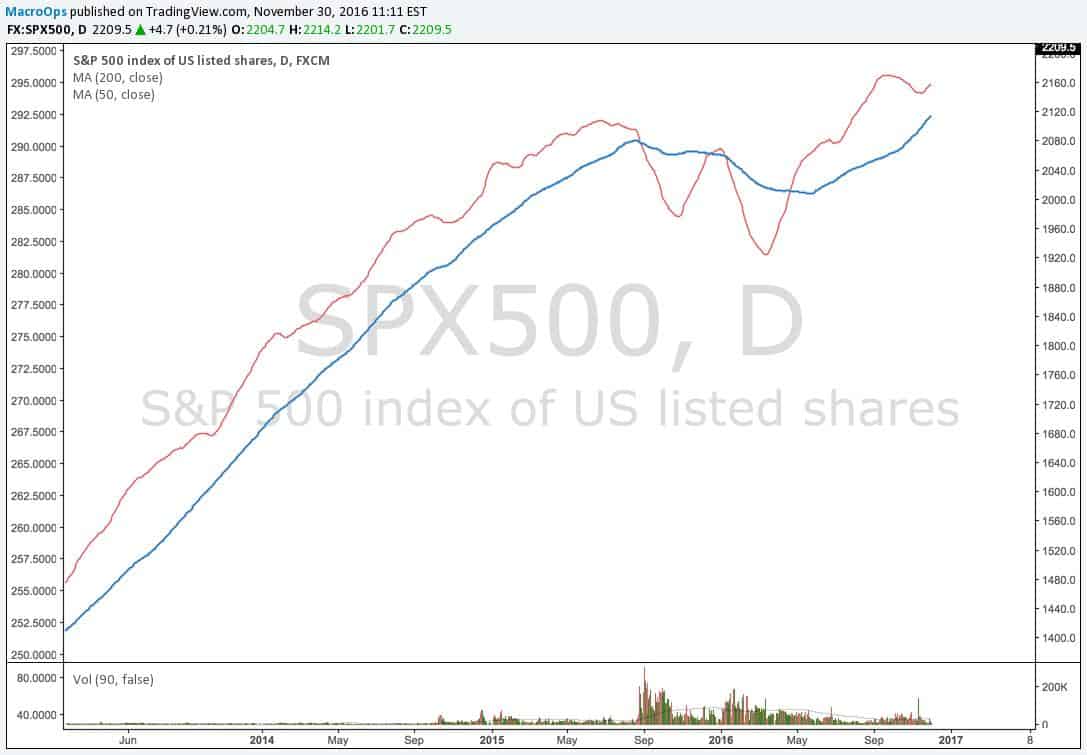
Below is a chart of the S&P 500’s 200 and 50-day moving averages. It shows that both are in a clear uptrend, meaning that on a cyclical and intermediate basis, the trend in US equities is up.
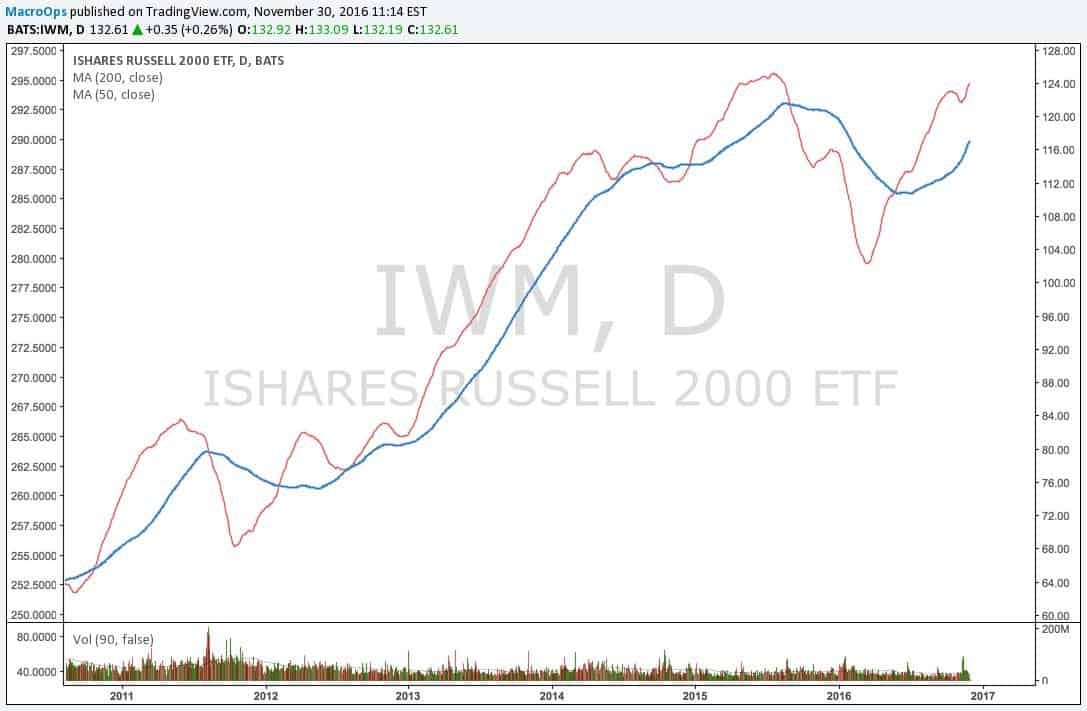
The chart below of small cap moving averages show the same thing. The trend is up on a cyclical and intermediate basis.
The next step is to look at gauges of liquidity to measure the durability and risks to these trends. Here’s a chart of JNK — the high-yield ETF.
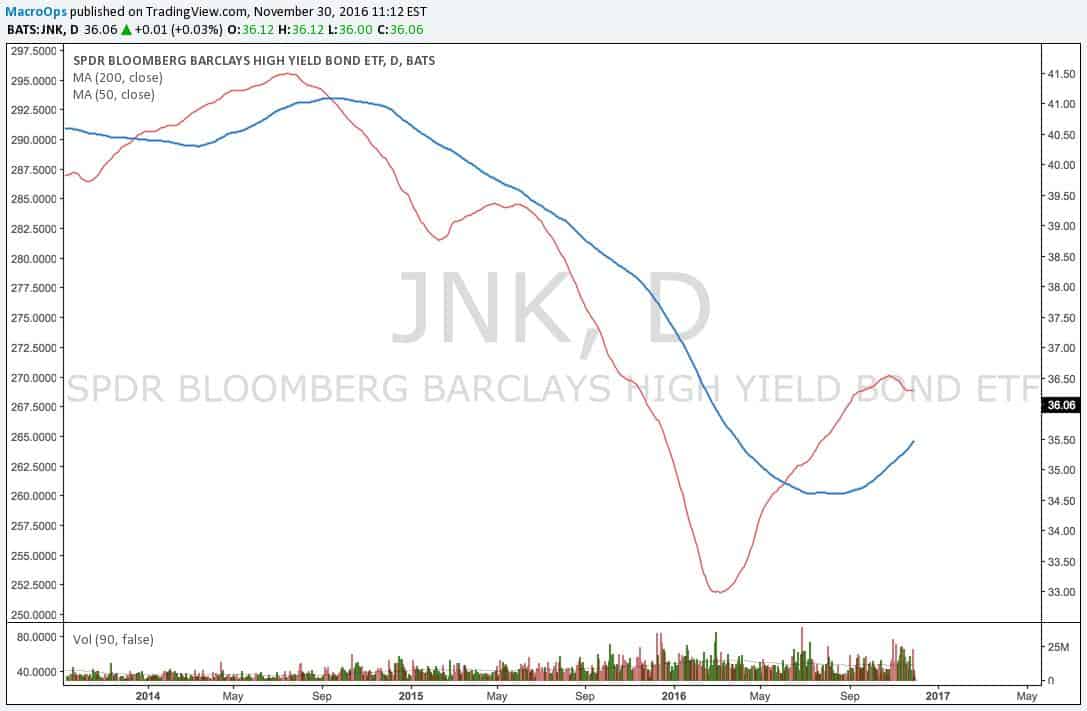
The 200 DMA is pointing up and the 50 DMA is in a broader uptrend even though it’s temporarily stalled. This is something to keep an eye on, but overall liquidity is positive for equities.
We can also take a look at the Hub’s proprietary liquidity gauge which aggregates a host of credit spreads.

The line on our liquidity model is pointing up — an equity positive.
We can now form our macro viewpoint on US equities:






Leave A Comment