
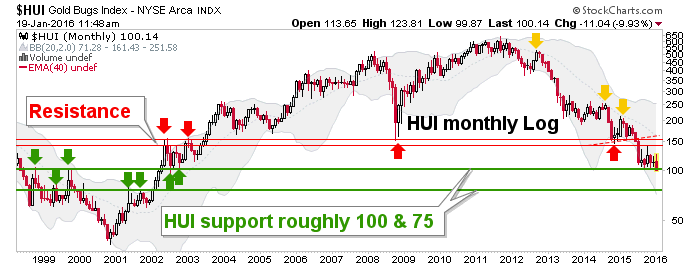
We have a target in the 70’s by a bigger picture monthly (log scale) chart that we have been following consistently in NFTRH. The log scale helps us see the support down in that area from 1999-2001. The decider on this is the support line at 100. That is based on there being no support until that area if the 100 level breaks down.
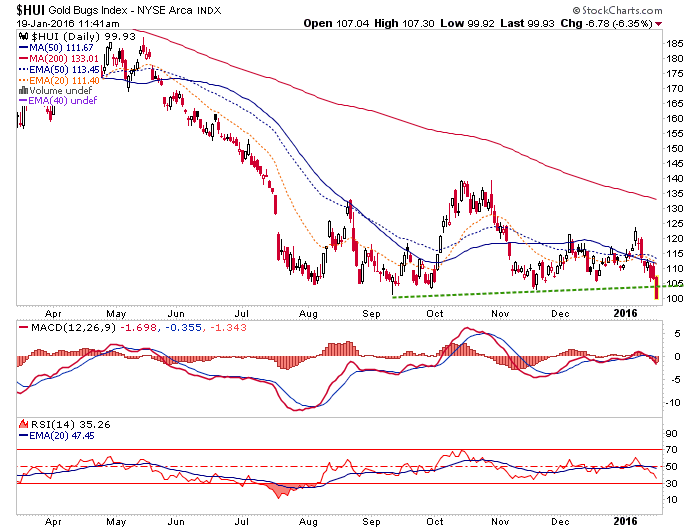
This daily chart breakdown, which I am sure every gold stock oriented chart jockey on the planet sees, measures to 66. Now, is it a whipsaw or a doorway to the 70’s or even 60’s? My hope is for the latter so that we can finally get the process done with. We’ll see though. The idea is to be positioned so as to not be hoping for anything.


Leave A Comment