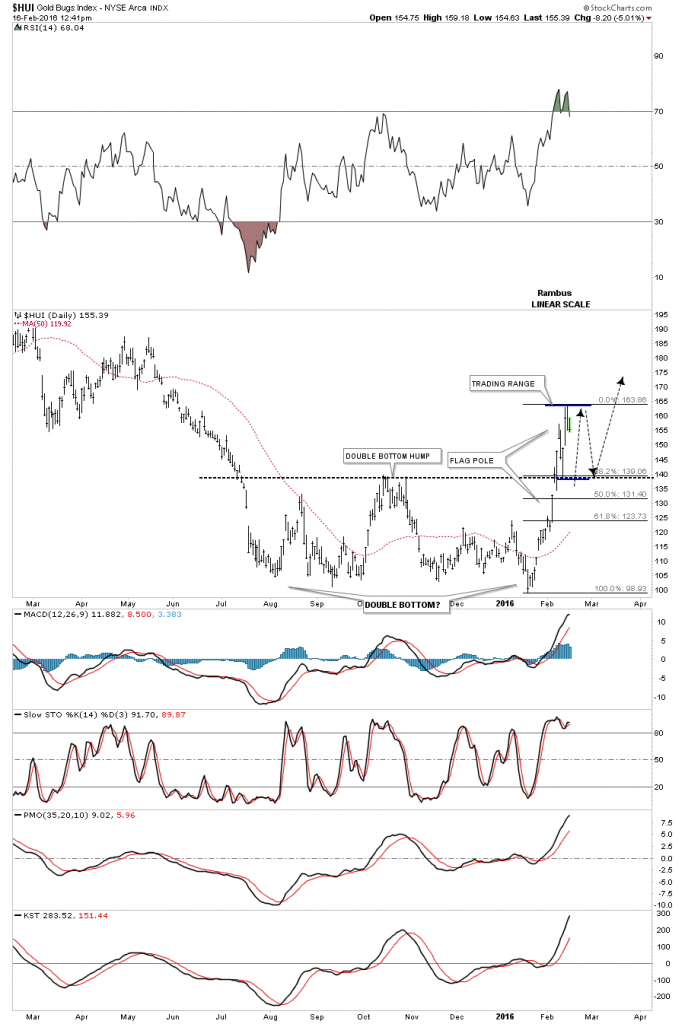
Below is a daily chart for the HUI which shows the double bottom with the breakout. I mentioned last week that in a perfect Chartology world this would be a good place to see some type of consolidation pattern form above the double bottom hump which comes in around the 139 area which would also be a 38% retrace of the recent rally. It’s critically important that the double bottom hump holds support during the consolidation phase. The volatility will most likely be extreme as the price action chops out a trading range with the volume getting lighter as the pattern builds out. It should only take about three weeks or so for this type of pattern to form if the rally was a flag pole. The main thing we want to see is for the double bottom hump to hold support around the 139 area. A break below that area would call into question whether or not the recent rally was just a short covering rally or the beginning of a new bull market.


Leave A Comment