The moves in Bitcoin are paling today in comparison to the forked-out Bitcoin Cash. The smaller cryptocurrency is surging on the Bitmain IPO and the Gemini listing. But what about the BTC/USD? The top cryptocurrency is looking for a direction and here are the levels to watch.
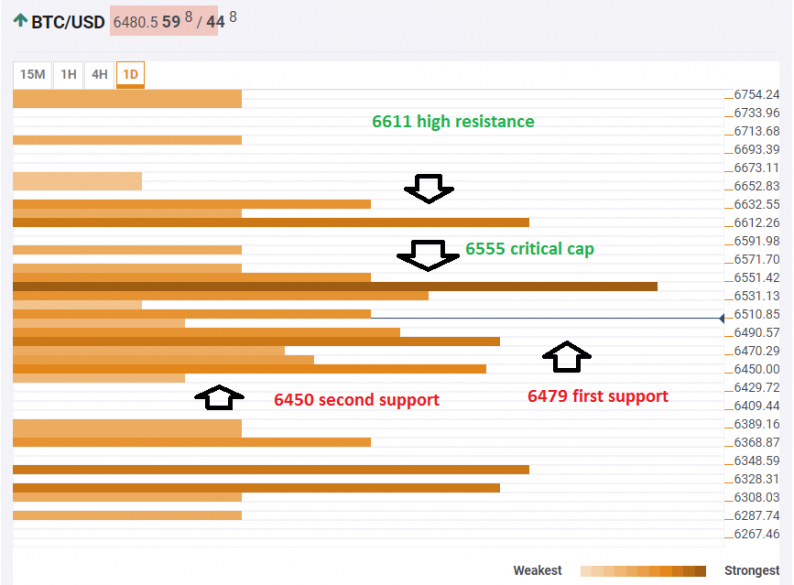
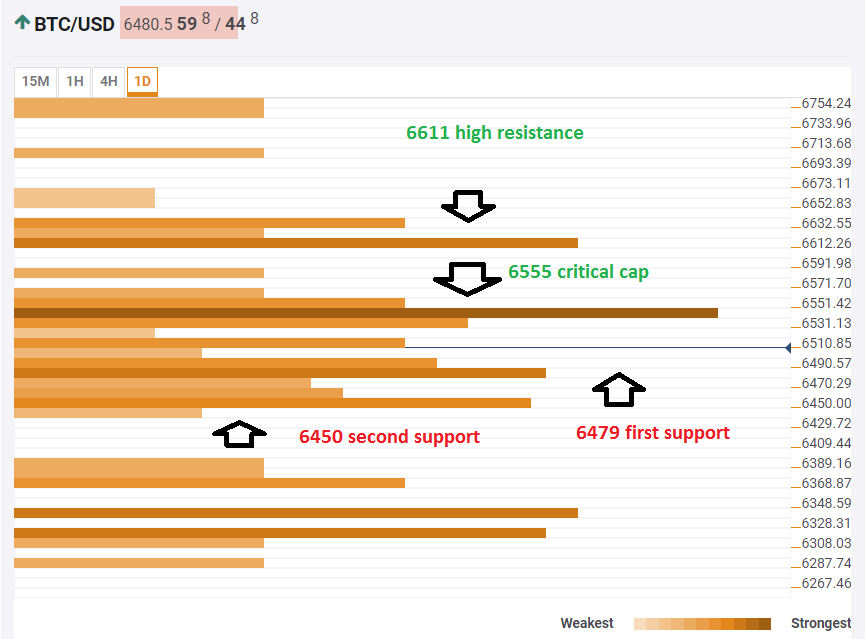
The Technical Confluence Indicator shows that Bitcoin first needs to cross the $6,555 level which is the convergence of the Pivot Point one-day Resistance one-day Resistance 1, the Simple Moving Average 50-4h, the SMA 200-1h, and the one-day high. This area is a critical resistance level and breaking it will open the path to softer caps.
At $6,611, the BTC/USD will find the confluence of the Fibonacci 61.8% one-month, the Pivot Point one-day Resistance 2, and the Fibonacci 23.6% one-week.
Above that, there is no significant resistance up to at least $6,754.
Looking down, there are plenty of support clusters. At $6,479 we see a more substantial one including the Simple Moving Average 10-1h, the SMA 5-4h, the SMA 50-15m, the Bolinger Band one-hour Middle, and the Fibonacci 38.2%.
At $6,450 we see the meeting point of the Fibonacci 61.8% one-day, the Bolinger Band one-day Middle, the BB 1h-Lower, and the SMA 50-1h.
Here is how it looks on the tool:
The Confluence Detector finds exciting opportunities using Technical Confluences. The TC is a tool to locate and point out those price levels where there is a congestion of indicators, moving averages, Fibonacci levels, Pivot Points, etc. Knowing where these congestion points are located is very useful for the trader, and can be used as a basis for different strategies.


Leave A Comment