
As of Wednesday’s market close, the S&P 500 Index is up 11% on a year to date basis, while most bond strategies have struggled to breakeven at best. Longer term bonds have been the most challenged as evidenced in the below chart. The iShares 20+ year Treasury Bond ETF (TLT) is down 7.7% year to date. Through Wednesday’s close, the 30-year U.S. Treasury is down 11.1% year to date. Of course, as interest rates rise, longer term bonds tend to be the least favorable bond investment as prices move inversely to the move in bond yields.

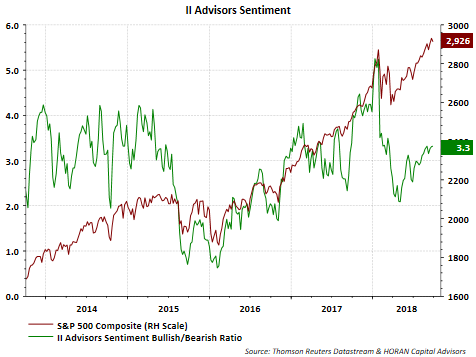
It is not hard to understand why individual investors are bullish on stocks if return is a factor in one’s bullish point of view. Thursday’s Sentiment Survey report by the American Association of Individual Investors noted bullish investor sentiment moved up 9.4 percentage points to 45.7%. Two-thirds of the bullishness increase came in a decline in bearish sentiment with the balance coming from a decline in the neutral sentiment category. The sentiment results can be volatile from week to week so the below chart contains the 8-period moving average of bullish sentiment. This average remains at about an average level and the contrarian sentiment results are most actionable at their extremes. As a result, this sentiment report is neither overly bearish or overly bullish. Other sentiment reports seem to fall in the neutral category as well. The second chart below displays the Investors Intelligence Bullish/Bearish Ratio and also not at either end of an extreme.

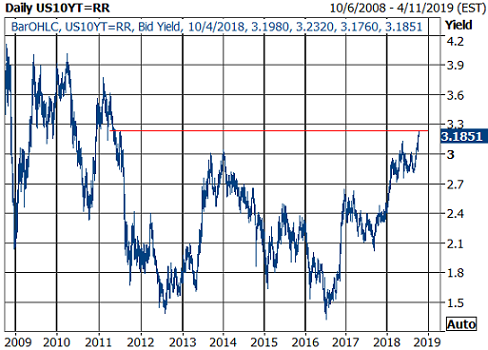
In the past month the yield on the 10-year U.S. Treasury has moved higher by 30 basis points and to a level last seen in 2011. This is a sharp move as rate moves go. Along with this move higher in interest rates, the equity market reacted negatively on Thursday falling .82% for the S&P 500 Index. A similar decline was experienced by the Dow Jones Industrial Average Index, falling 200 points or .75%.
Stocks can perform well in a rising rate environment though and I wrote about this in early 2014 in a post titled, Rising Interest Rates Can Be Good For Stocks. That article contained the below table showing the S&P 500 Index moved higher in 10 out of 13 rising rate periods going back to 1970.


Leave A Comment