
As forecasted by Investinghaven, India’s stock market had a stellar performance in 2017. India’s NIFTY 50, representing 50 of India’s large capitalization started 2017 at 8000 to recently cross above the 10000 level. INDY, iShares’ India 50 ETF tracking the performance of NIFTY 50 is up more than 30% for the year.
In our article today, we will cover the performance of NIFTY 50 and important price levels to watch. We will also look into the recent tracking divergence Between INDY and NIFTY 50.
NIFTY 50 Outlook Based on Chart Setup
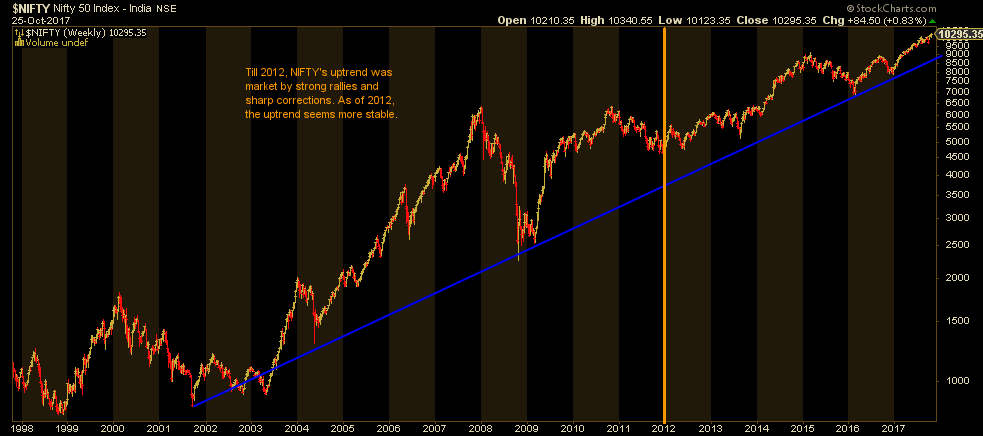
NIFTY 50 has a long term Bullish chart setup. That doesn’t rule out the healthy pullbacks and as we notice from the chart below, NIFTY’s corrections are less and less pronounced, especially after major runs.
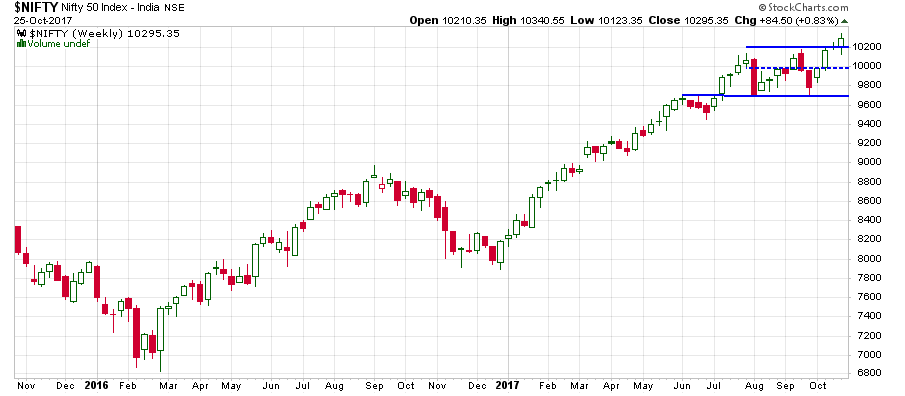
Zooming in to look at the recent performance, we see a sideways price movement happening since June 2017, which could be the base for another uptrend end of 2017 and early 2018.
In short, These are the NIFTY 50 important price levels to watch:
NIFTY 50: A Fundamentally important factor to consider
India announced the following yesterday, Tuesday October 24th:
Over the next two years, New Delhi plans to pump in 2.11 trillion rupees (about $32 billion) into public sector banks in a bid to increase money flow, loosen credit conditions, and boost investment and growth.
The government plans to finance 1.35 trillion rupees ($20.7 billion) by issuing bonds. Another 760 billion rupees ($11.7 billion) is set to come from the budget or the institutions’ own fund-raising efforts.


Leave A Comment