
Welcome to edition 284 of Insider Weekends. Insider buying declined last week with insiders buying $67.18 million of stock compared to $132.46 million in the week prior. Selling also decreased with insiders selling $1.85 billion of stock last week compared to $2.15 billion in the week prior.
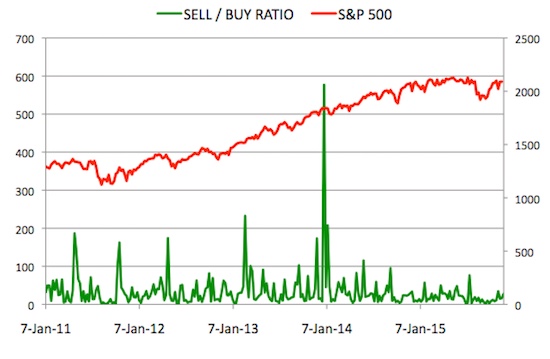
Sell/Buy Ratio: The insider Sell/Buy ratio is calculated by dividing the total insider sales in a given week by total insider purchases that week. The adjusted ratio for last week went up to 27.49. In other words, insiders sold more than 27 times as much stock as they purchased. The Sell/Buy ratio this week compares unfavorably with the prior week, when the ratio stood at 16.24. We are calculating an adjusted ratio by removing transactions by funds and companies and trying as best as possible only to retain information about insiders and 10% owners who are not funds or companies.
Note: As mentioned in the first post in this series, certain industries have their preferred metrics such as same store sales for retailers, funds from operations (FFO) for REITs and revenue per available room (RevPAR) for hotels that provide a better basis for comparison than simple valuation metrics. However metrics like Price/Earnings, Price/Sales and Enterprise Value/EBITDA included below should provide a good starting point for analyzing the majority of stocks.
Notable Insider Buys:
1. Southern Copper Corp. (SCCO): $25.68
Chairman of the Board German Larrea Velasco acquired 334,000 shares of this copper mining company, paying $27.14 per share for a total amount of $9.06 million. Mr. Velasco increased his stake by 13.17% to 2,870,567 shares with this purchase.
This is the fifth time in the last three months we have reported on large insider purchases by Mr. Mota-Velasco. These purchases come against a very weak backdrop for copper prices, that are at a six year low and have only been lower during the great recession going back a decade.
You can view the list of recent insider transactions for Southern Copper Corp. here.
2. Platform Specialty Products Corporation (PAH): $12.33


Leave A Comment