
As I write this on Thursday night, very few people know what the August employment report will show. Only the President, Vice-President, and a few top economists get an advance look on Thursday afternoon. The BLS is in lockdown mode for eight days. Media sources get a look on Friday morning, but are cut off from communications until the embargo ends at 9:30 Eastern Time.
Second best is having the background and context for intelligent interpretation of the data.
What is job growth?
Many (most?) sources call the headline number of the report “job growth” or the number of jobs created. Not so. It is actually the net increase in jobs. A look at the actual data will make the significance clear.
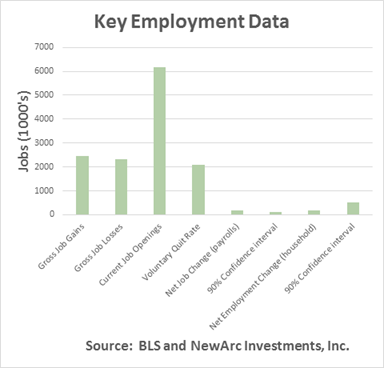
Monthly gains in new jobs are nearly 2.5 million. Job losses are a bit less. The difference between the two is the widely reported net increase. Millions of jobs end and millions of others begin each month. The number of people affected by this is far greater than the net jobs story suggests.
Also dwarfing the net change number is the story behind the dynamic. Currently there are over 6 million open jobs. More than 2 million workers voluntarily quit their jobs in the last reported month. The net job change is small in comparison with both of these numbers.
Misleading Focus on the Net Change
Let us now consider the much smaller net change – the most widely cited number. The table below shows the average change in the establishment survey over the last year, about 180K. It also shows the 90% confidence interval, about 120K. The confidence interval is the result of sampling error, inherent in the survey process. It is not something that is “fixed” by revisions in later months.
The household survey counts workers rather than jobs. This means that someone who works several jobs is only counted once. Since the sample is smaller, the confidence interval is much larger, about 500K.
The key point? The typical monthly change is not great when compared to the confidence interval.


Leave A Comment