
By all accounts, the world is awash with oil: production remains high while demand is softening along with the global economy. This has led many observers to forecast further declines in oil from the current price (in USD) of around $35/barrel.
This Is Why $20 Oil Is A Possibility (Zero Hedge)
IEA Offers No Hope For An Oil-Price Recovery
Despite the downward pressure on oil, the devil’s advocate wonders: could oil be setting up a tradable bottom? By tradable bottom I mean a level from which oil might bounce. For example, oil reversed from the low $40s earlier in 2015 and climbed to about $60 before resuming its downtrend.
Put another way: if oil’s ultimate bottom is $20/barrel, it is likely to experience sharp rebounds/retraces along the way, just as it did early in 2015. These near-term lows are tradable bottoms rather than the final long-term low, which is anyone’s guess.
Consider the daily chart of WTIC oil, which is tracing out a bullish descending wedge. The stochastic is also oversold. MACD is weak and bleak, but the punch through the lower Bollinger Band leaves the door open to an exhaustion move.

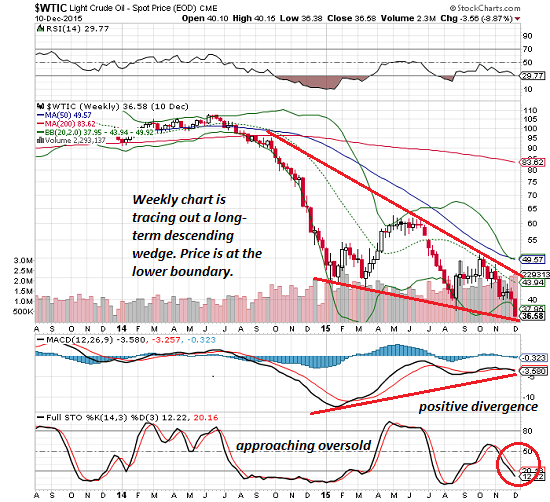
The weekly chart of WTIC oil is also tracing out a bullish descending wedge. Interestingly, MACD has been diverging, rising even as oil has broken down to new lows. Oversold can stay oversold for a long time, but it is still worth noting the stochastic is approaching oversold levels.
One way to assess if an asset or commodity is at an extreme is to compare its price with the price of gold and oil. Over the long-term, these ratios tend to revert to the mean.
Consider this chart of the gold-oil ratio: it is now pushing 30, which means one ounce of gold buys 30 barrels of oil.

You can see that typically the ratio is between 10 and 20. When oil was almost $150/barrel, the ratio sank near 7–an extreme at the other end of the scale.
Gold to Oil Ratio Historical Chart


Leave A Comment