Should investors use bond yields as a baseline to determine if stocks are over-or-under valued?
If you believe in the “Fed Model,” your answer is “yes”. The model instructs investors to compare the S&P 500’s earnings yield (Earnings/Price, the inverse of the P/E ratio) to the 10-Year Treasury yield:
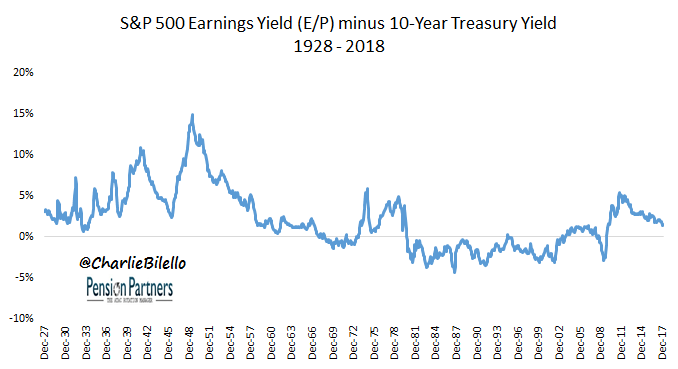
With the Earnings Yield (“EY”) today currently above the 10-Year Treasury Yield (“TY”), many pundits are arguing that stocks are still undervalued (and therefore attractive), despite other metrics indicating otherwise (click here for a recent post on this). Are these pundits correct? Is comparing the Earnings Yield to Treasury Yields an effective way to value stocks and forecast future equity returns? Let’s take a look…

Data Sources for all charts/tables herein: Robert Shiller, Bloomberg, YCharts.
Going back to 1928, we can separate EY minus TY into deciles, from lowest (-4.4% to -2.1%) to highest (7.0% to 14.9%). We can then calculate average and median forward returns over the next 1 to 10 years within each decile…

If you’re struggling to find a strong relationship in the above tables, that’s because there isn’t one. While the highest EY-TY decile is indeed followed by the strongest returns, the lowest EY-TY decile has above-average returns from 4 years through 10 years forward. The weakest returns reside in the middle deciles (4-7), with a slight bias to higher forward returns with higher EY-TY starting levels.
We can observe this bias in the upward slope of the trendline line in the scatter chart below, which compares the starting EY-TY levels to forward 10-Year Total Returns. The R Squared, in this case, is .11, meaning that knowledge of EY-TY accounts for only 11% of the variation in future 10-year returns.


Leave A Comment