The economy is a forest. Individual stocks are like trees.
As in, “We can’t see the forest for the trees.”
Most of us focus on specific assets and the markets they inhabit. A basket of stocks in the S&P 500, for example.
There’s danger in that.
If you’ve chosen well, and your picks show nice returns, that hyperfocus might miss trends that say it’s time to run for cover.
Those trends show up in the real-world economy before they affect stock markets. But warning signs exist even in stock markets… if you know to look for them.
I looked… and those warning signs are flashing fire-engine red. Learning to interpret them could help your portfolio survive the next recessionary fire.
Dude, Where’s My Profit?
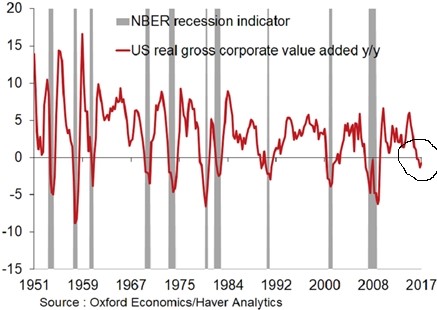
Let’s start with an indicator that reveals what’s going on in the “real” economy of physical goods and nonfinancial services. It leaves out the FIRE sector (finance, insurance, and real estate).
Gross value added of nonfinancial companies after inflation measures the net value of goods and services produced after adjusting for production costs.
When it’s negative, it means companies aren’t making money from selling their wares. If they’re showing profits in their quarterly reports, it’s coming from somewhere else — cost-cutting, layoffs, asset sales and so on. Those aren’t sustainable.
Moreover, whenever this indicator falls below zero on a year-on-year basis, the U.S. economy enters a recession — every single time:

This measure just turned negative. Why should this time be any different?
The Slinky Cycle

Think of the economy and its business cycle as a compression wave — a Slinky, for example.
As economic activity increases, firms make more profit. They use that profit to invest in new productive capacity, hire workers and grow.
That spending ripples out through the economy, as workers spend wages and producers of capital goods expand their own operations, and so on.


Leave A Comment