
The S&P 500 Index (chart below) shows a top in May 2015, a correction into August, and a deeper fall this month – February 2016. Look out below.

The Shanghai Composite Index looks grim.

Both markets are due for a bounce with more downside thereafter.
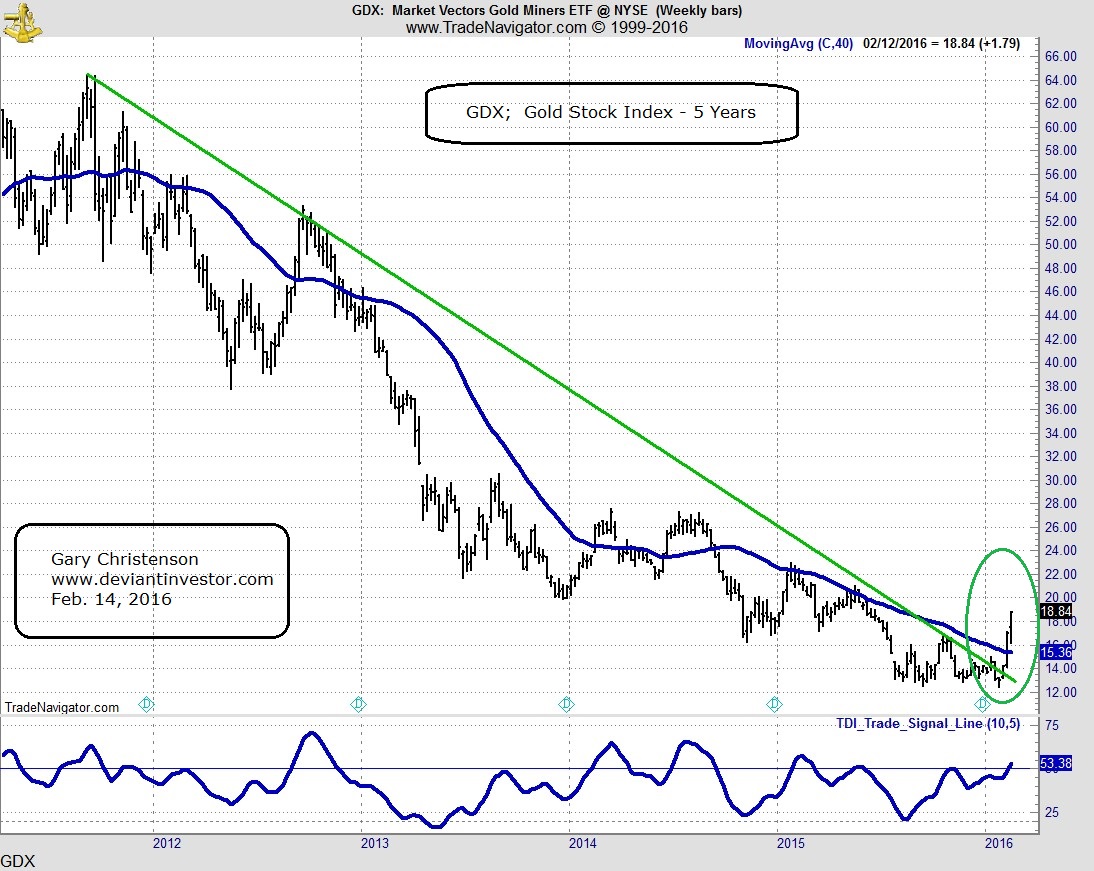
Gold mining stocks (the GDX) have rallied over 50% since the January low. They should correct and then rally for several years.
The chart of gold looks similar.It has broken out of a long term downtrend, looks ready to correct, and then continue its rally past all-time highs.

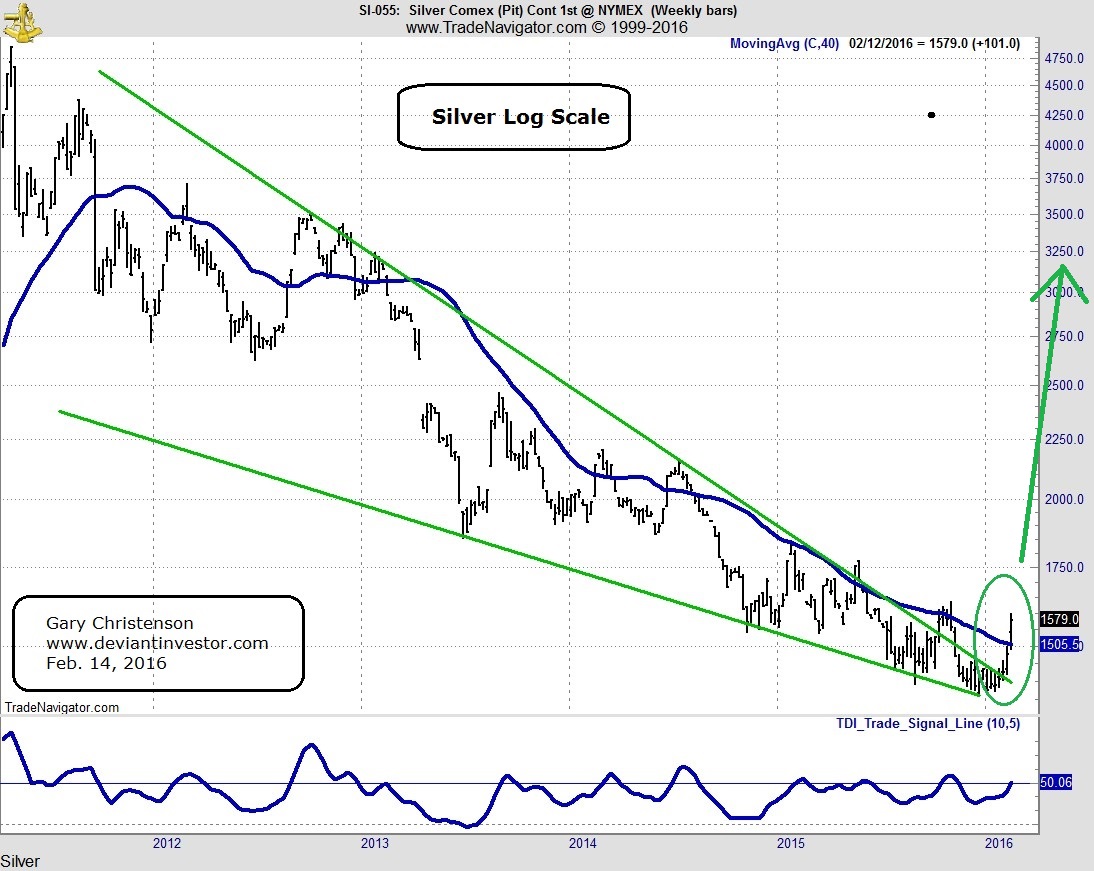
The silver chart is showing the same message as gold – a bottom, breakout, possible correction, and then more rally. Expect all-time highs in 2016 – 2017.
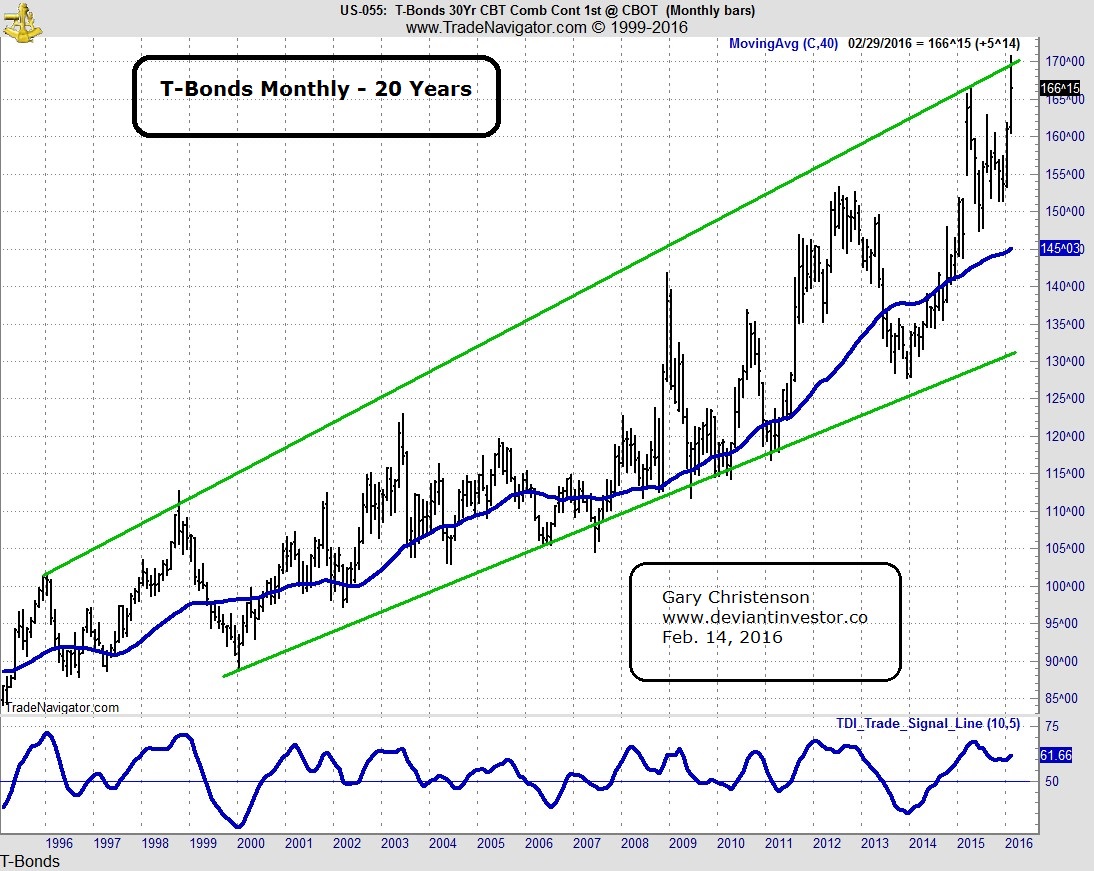
T-Bonds (monthly chart) look ….well, crazy. For a start, who lends capital to insolvent governments for 30 years at 2%?Worse, who lends capital to insolvent governments for 10 years at negative rates? You “benefit” from guaranteed capital destruction and are repaid in a devaluing currency?Desperation? Markets have gone insane? The new normal?Increase debt to solve an excess debt problem? QE did not work – so the central banks must not have done enough of it? Strange and getting stranger, or just utterly insane?
The US dollar began a furious rally in mid-2014 and peaked in March 2015. Crude oil and commodity prices have not recovered. Emerging markets have been hammered. Was the rally caused by the “strong fundamentals” of the US economy, “strength” in the US job market, “excellent management” in the US government, “intelligent and healthy” economic direction from the Fed, or …should we expect a massive correction that brings the US dollar back towardthe 70s?
From Martin Armstrong:


Leave A Comment