
Written by John Lounsbury and Steven Hansen
The headlines say new home sales significantly declined from last month – and is in contraction year-over-year. The rolling averages smooth out much of the uneven data produced in this series – and this month there was a decline in the rolling averages. Likely it was the weather BUT new home sales have been on a declining trendline.

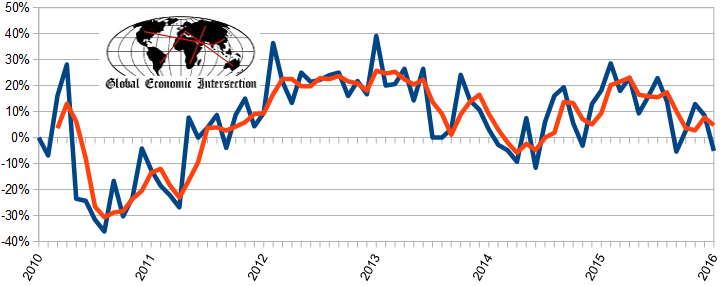
As the data is noisy, the 3 month rolling average is the way to look at this data. This data series is suffering from methodology issues. Econintersect analysis:
Unadjusted Year-over-Year Rate of Growth – Sales (blue line) and 3 month rolling average of Sales (red line)
US Census Headlines:
The quantity of new single family homes for sale remains well below historical levels.
Seasonally Adjusted New Homes for Sale

As the sales data is noisy (large monthly variations).
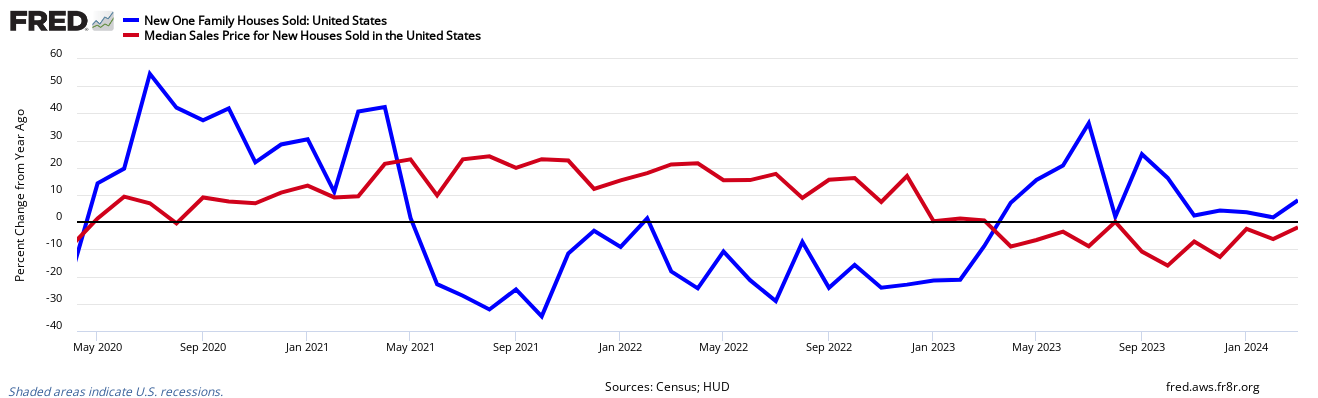
Year-over-Year Change – Unadjusted New Home Sales Volumes (blue line) with zero growth line emphasized
The headlines of the data release:
Sales of new single-family houses in January 2016 were at a seasonally adjusted annual rate of 494,000, according to estimates released jointly today by the U.S. Census Bureau and the Department of Housing and Urban Development. This is 9.2 percent (±13.5%)* below the revised December rate of 544,000 and is 5.2 percent (±12.6%)* below the January 2015 estimate of 521,000.


Leave A Comment