The Wall Street Journal has an interesting report on the jobs created since the recession. The article takes a close look at employment and wage data to see the makeup of newly created jobs.
There are some flaws and data inaccuracies in the Journal report. Nonetheless it is an excellent starting point for discussion.
Please consider Just How Good (or Bad) Are All the Jobs Added to the Economy Since the Recession?
One refrain we hear often from readers of Real Time Economics is that the majority of jobs employers are creating are — in their words — not good, part time, temporary or seasonal minimum-wage positions offering scant benefits, mostly in the service sector.
“Nobody could live on just one of these jobs,” J. Thomas Gaffney wrote in a Facebook comment in March. “It’s not the quantity of jobs that matters, it’s the quality, and these jobs are not quality jobs that pay a living wage or provide decent benefits.”
Mr. Gaffney’s comments, and others like it, pose a difficult question: How do you measure the quality of all the jobs the U.S. added and lost in a given month?
The top line figure from the employment report masks all sorts of variation. Millions of Americans quit or are laid off each month, while millions are hired to new jobs.
The journal provides a snapshot of job sectors ans also lists 117 job categories and provides a nice spreadsheet one can sort on numerous ways.
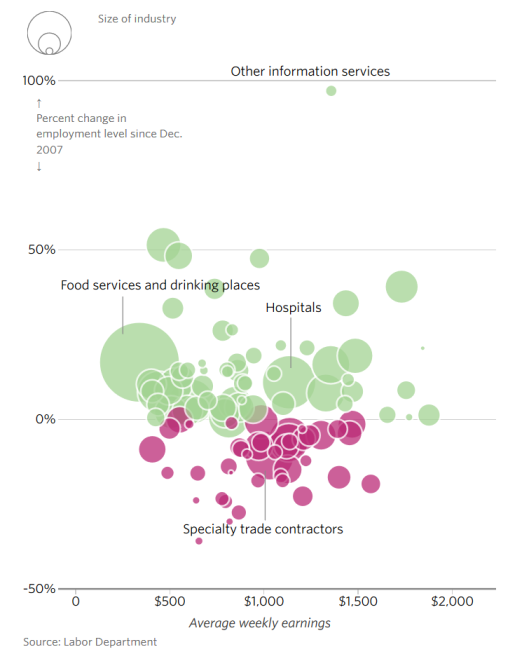
Job Snapshot

The problem with the snapshot is it gives more weight to growth rather than the actual size of the growth or contraction.
Find Your Industry
The Journal has a very nice “Find Your Industry” sortable list of 117 job categories. In the list I found at least one of data error.
I also caution about overlapping job categories. Here is a section of the table I produced, sorted by size of industry, not size of growth.
I added the last two columns.


Leave A Comment