
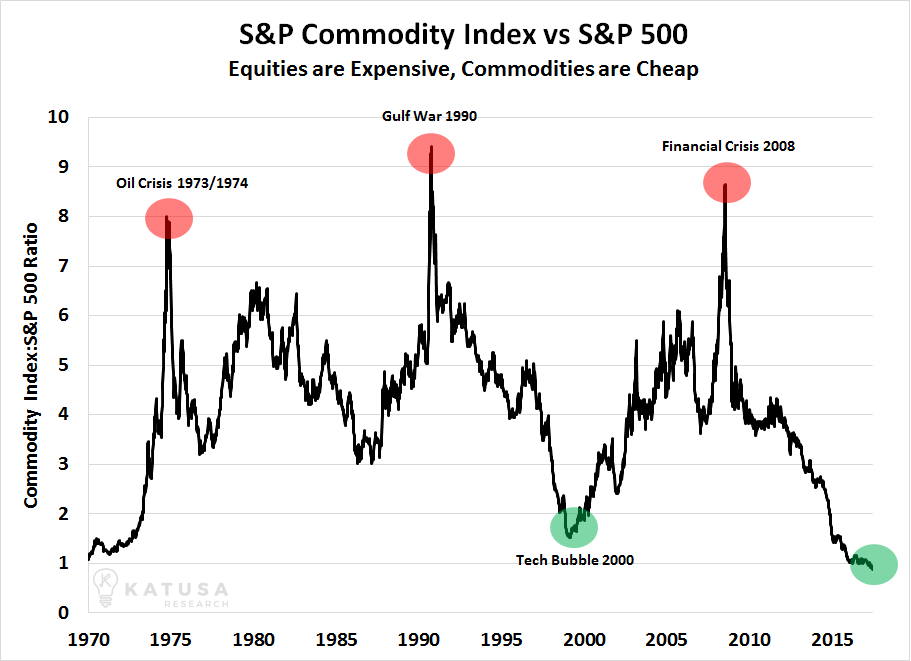
In 2017, commodity prices slumped to a 50-year low compared to US stocks. Over the last 100 years, that low ratio happened only twice. And as we begin 2018, the SPY continues to increase in value.
Do commodities love a crisis?
War, financial meltdowns, environmental disasters, coups – these are the top reasons commodities rally and create a potential hyperinflationary environment.
If we accept that as true, then what could possibly reverse this historically low relationship?
After all, the market fear factor indicates virtually zero fear that any of these crises can happen anytime soon.

This chart, part of MarketGauge’s BigView Indicators, was updated as of the close of January 4th.
The four Risk On/Off confirmation indicators are as follows:
SPY vs TLT – This ratio measures the relationship between what is considered to be the safest debt instrument (U.S. bonds) versus the benchmark stock index, the S&P 500. When the ratio is trending up and the distance between the ratio and the moving average widens, it identifies an increased appetite for risk in the market. Bullish.
HYG vs TLT – This ratio measures the relationship between risky high yield corporate debt (HYG) versus the safety of U.S. Bonds (TLT). When the ratio is trending up and the distance between the ratio and the moving average widens, it identifies an increased appetite for risk in fixed income markets.
SPY vs GLD – This ratio measures the relationship between the S&P 500 (SPY) and Gold (GLD).
When the ratio is trending up and the distance between the ratio and the moving average widens, it generally identifies an increasing appetite for risk and is viewed as favorable to stocks.
WOOD vs GLD – This ratio measures relationship between gold (GLD) and lumber (WOOD). When this ratio is trending up it indicates that the relative performance of lumber is improving versus gold.
Lumber is a key input into construction which tends to increase in strong or improving economic conditions. When the ratio is trending up and the distance between the ratio and the moving average widens, it serves as a good risk-on indicator.


Leave A Comment