
With each passing day this year, it seems as though the underperformance of small caps relative to large caps keeps getting wider. While the small-cap Russell 2000 is currently down over 30% from its post-Covid highs and within 1% of a multi-year low, large caps have held up relatively well as the S&P 500 is less than 12% from its post-Covid high. As a result of the divergence, the large-cap S&P 500 is outperforming the small-cap S&P 600 by more than 15 percentage points in 2023.Just like the overall indices, the performance gap between the two is also wide across most sectors. The chart below compares the YTD performance of large (S&P 500) and small-cap (S&P 600) sectors so far this year. Amazingly, while the large-cap Communication Services and Technology sectors are both up over 30% YTD, their smaller-cap peers are either slightly down or just marginally higher. Within the Consumer Discretionary sector, there has been a similar pattern although to a less extreme of degree.Outside of those three sectors, there really isn’t much in the way of gains for other large-cap sectors, but even if they are flat to down on the year, they’re still outperforming their smaller-cap peers. Of the eleven sectors, the only three where small caps are outperforming large caps are Consumer Staples, Energy, and Industrials. In the two latter sectors, not only are they outperforming, but they’re also the only two sectors in the S&P 600 with gains on a YTD basis. Imagine that, gains in small caps!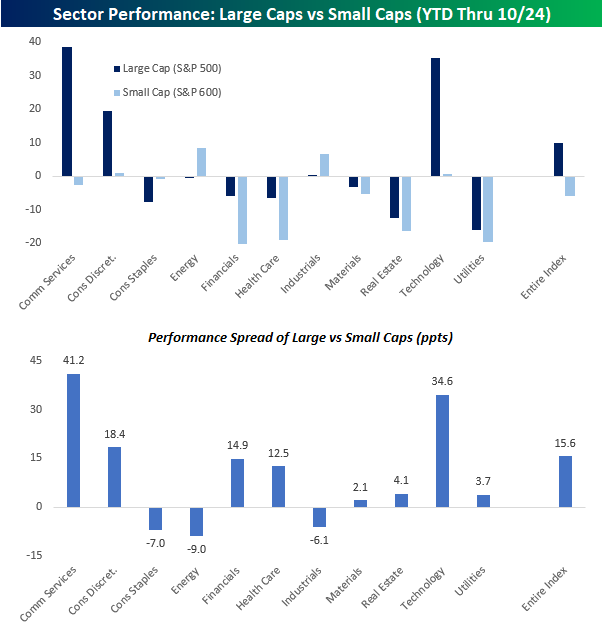 More By This Author:Breadth Bombs
Nasdaq Corrections
Average S&P 500 Stock Down 9.9% Since July Peak


Leave A Comment