
What Once Was Resistance
Given the market’s near addiction to low-interest rates and recent price action, it is helpful to get some guideposts based on the expression:
“What once was resistance may now act as possible support.”
The expression above includes two keywords: “may” and “possible”, meaning there is no market law bounding price to act in any particular manner at any particular level. However, we know markets often retest breakout levels or areas of past resistance.
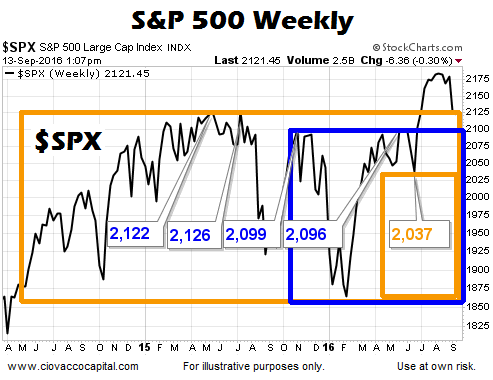
S&P 500 Weekly
Weekly charts can help us zero in on the most important levels. The weekly chart of the S&P 500 below shows, prior to the recent bullish breakout, sellers became more active between 2,096 and 2,122. If those levels are taken out on a weekly basis, our concerns would increase with a weekly close below the Brexit low of 2,037.
Weekly charts print only one price each week. Therefore, intro week moves are not as relevant as the close for the week.
SPY Weekly
The weekly chart of the S&P 500 ETF (SPY) below shows, prior to the recent bullish breakout, sellers became more active between 207.46 and 209.15. If those levels are taken out on a weekly basis, our concerns would increase with a weekly close below 202.91.

Prudent To Respect All Outcomes
While the longer-term outlook has not deteriorated in a significant manner yet, as outlined on September 9 and September 12, recent volatility and the near-term economic calendar tell us to respect any and all outcomes. With two economic reports (PPI and CPI) related to inflation on this week’s docket, the market will be watching closely. If there is one thing that can force the Fed’s hand on interest rates, it is a surprising pop in inflation. Our ETF scoring system tells us our positions are a bit more vulnerable, but the facts have only moved into a “pay closer attention” zone at this time.


Leave A Comment