GAAP Results
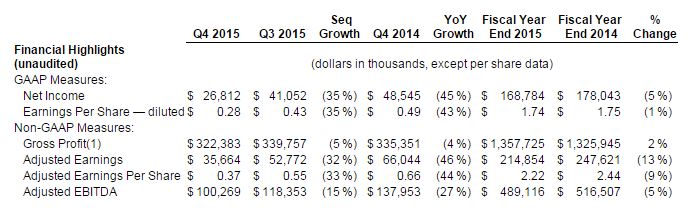
Q4 2015 net income of $27 million, or $0.28 per share; FY 2015 net income of $169 million, or $1.74 per share
Q4 2015 pre-tax income of $45 million; FY 2015 pre-tax income of $283 million
Non-GAAP Results
Q4 2015 Adjusted Earnings of $36 million, or $0.37 per share; FY 2015 Adjusted Earnings of $215 million, or $2.22 per share; includes non-recurring cost of $0.04 per share
Q4 2015 Adjusted EBITDA of $100 million; FY 2015 Adjusted EBITDA of $489 million
Q4 2015 gross profit of $322 million; FY 2015 gross profit of $1,358 million
Key Metrics
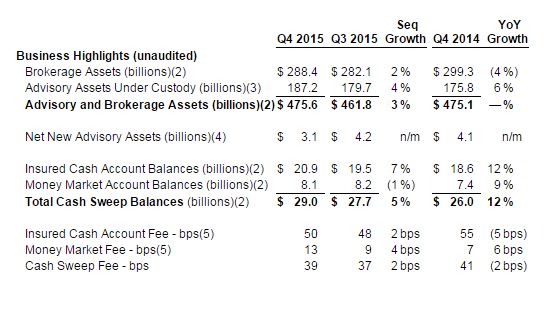
End of period total brokerage and advisory assets of $476 billion
Q4 2015 net new advisory assets of $3.1 billion; FY 2015 net new advisory assets of $16.7 billion
End of period cash sweep balances of $29.0 billion
Capital Management
Q4 2015 share repurchases of $250 million for more than 5.6 million shares; FY 2015 share repurchases of $391 million for more than 8.9 million shares
Q1 2016 to date share repurchases of $25 million for more than 630 thousand shares
Q4 2015 dividends of $24 million; FY 2015 dividends of $96 million
SAN DIEGO, Feb. 11, 2016 (GLOBE NEWSWIRE) — LPL Financial Holdings Inc. (NASDAQ:LPLA) (the “Company”) today announced results for its fourth quarter ended December 31, 2015, reporting net income of $27 million, or $0.28 per share. This compares with $41 million, or $0.43 per share, in the prior quarter and $49 million, or $0.49 per share in the fourth quarter of 2014. Fourth quarter 2015 adjusted earnings totaled $36 million, or $0.37 per share. This compares to $53 million, or $0.55 per share, in the prior quarter and $66 million, or $0.66 per share, in the fourth quarter of 2014.
“The market environment was volatile and challenging in 2015, particularly for brokerage sales,” said Mark Casady, chairman and CEO. “So we focused on bringing assets onto our platform and executing on our operational, efficiency, and capital plans.”
Casady continued, “As we move into 2016, market volatility has only increased, and we expect continued pressure on brokerage sales. That being said, we believe our scale and stability give us an advantage in markets like this. We remain focused on growth, delivering on our expense and capital plans, and managing the DOL rule transition.”
“The market environment was tough in the fourth quarter, but we made progress on expenses and capital,” said Matt Audette, chief financial officer. “We managed our expenses slightly lower than our outlook while executing several efficiency initiatives to position us for lower G&A growth in 2016.”
Audette continued, “We also completed our debt transaction and the first $250 million of our $500 million share repurchase plan in the fourth quarter. In the first quarter of 2016 to date, we have repurchased another $25 million of our shares. Given the volatile start to the year, we will be flexible and dynamic going forward in our expense and capital plans.”
A full reconciliation of GAAP measures to non-GAAP measures, along with an explanation of these metrics, follows later in this release.
Fourth Quarter 2015 Financial and Business Highlights
Assets
Brokerage and advisory assets were $476 billion, up 3% sequentially.
Net new advisory assets were $3.1 billion, translating to a 7% annualized growth rate.
Advisors
Advisor count was 14,054, down 19 from the third quarter.
Advisor production retention finished the year above 96%.
Gross Profit
Commissions were $464 million, down 4% from the prior quarter. Sales commissions declined mostly due to an industry-wide slowdown in alternative investments, and trailing commissions were relatively flat.
Advisory fees were $324 million, down 5% from the prior quarter. Advisory fees are primarily billed on prior quarter balances, and third quarter asset levels declined sequentially along with the S&P 500 index.
Asset-based fees were $124 million, flat sequentially. Sponsor revenues declined 4% due to lower billable assets. Cash sweep revenue increased 13% from client cash sweep balance growth and the mid-December increase in the target range for the federal funds rate.
Transaction and fee revenues were $97 million, down 8% sequentially primarily due to the timing of conferences as well as slightly lower trading volumes.
Expenses
Core G&A expenses were $179 million, up $8 million sequentially. $4 million of this increase was due to non-recurring costs, which were mostly severance. The remaining increase was primarily due to annual disclosures and investments in service and technology offset by lower performance-based compensation. For 2015, core G&A expenses were $695 million, below LPL’s expected range of $697 to $703 million.
Promotional expenses were $35 million, down $7 million sequentially. Conference expenses declined $13 million sequentially while increased transition assistance and year-end marketing expenses added $6 million.
Regulatory-related charges, which include the cost of restitution and remediation of previously settled regulatory matters, were $8 million, flat sequentially. For 2015, regulatory related expenses totaled $34 million, down $2 million from 2014.
Depreciation and amortization of intangibles was $32 million, up $5 million sequentially mostly due to non-recurring real estate consolidation.
Interest expense was $18 million, up $5 million sequentially following LPL’s November debt transaction.
Adjusted Earnings
Adjusted Earnings were $36 million, or $0.37 per share. These results included $0.04 per share of non-recurring costs totaling $7 million of pre-tax expense.
The non-recurring costs included $4 million of non-recurring core G&A that was primarily related to severance for role eliminations, and $3 million of non-recurring depreciation for real estate consolidation.
Historically, these non-recurring costs would have been adjusted out of Adjusted Earnings.


Leave A Comment