
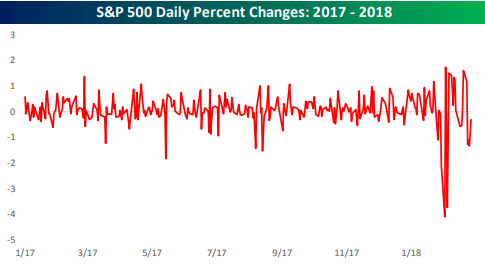
We were reminded of an EKG when we made the chart below. The chart shows the S&P 500’s daily percentage change going back to 2017.
Aside from a few skips here and there, the market’s “EKG” looked pretty stable throughout 2017. Since early 2018, however, things have gone haywire, with violent daily moves in both directions.
If the market is the patient, who/what is the cause of the stress, and who/what is the doctor that can resolve the problem? Your average investor watching from the sidelines is like the nervous family member watching closely in the waiting room.
There are any number of ways you can answer the questions above. Rising interest rates, valuations, the short-vol trade, over-heating, inflation, and now tariffs are all possible answers as to the cause. Or maybe it’s just old age. As to how the stress gets resolved, if the main doctor is the Fed, they’ve got quite the predicament on their hands since they’re also a potential cause of the stress.
We’ll stop here before going even further down this metaphorical rabbit hole. The bottom line is that daily volatility has picked up quite significantly from where it stood throughout 2017, and at this point, the only remedy might be time.


Leave A Comment