
This week I want to discuss several risks I am currently watching starting to manifest “behind the scenes” so to speak. But first, let’s take a quick review of the markets which currently are flashing some very troubling signs.
Last week, I discussed the ongoing consolidation and struggle as the markets remain “trapped” between downtrend resistance and the crucial support levels of the previous breakout to new highs. The charts below have been updated through Friday afternoon.
(Note: as I am writing this Jason Chaffetz just confirmed the FBI was reopening the investigation into Hillary Clinton’s emails based on new evidence. This has caused the market to panic a bit and the battle to hold support is being waged as I write this.)
FBI Dir just informed me, “The FBI has learned of the existence of emails that appear to be pertinent to the investigation.” Case reopened
— Jason Chaffetz (@jasoninthehouse) October 28, 2016

The two dashed red lines show the tightening consolidation pattern more clearly.
Importantly, while the market has remained in suspended animation over the past three months, the deterioration of the market is quite evident. However, despite the ongoing political circus, weak corporate earnings (considering the massive reductions in expectations since the beginning of the year), Apple (AAPL) and Amazon (AMZN) both missing expectations (which really goes to the heart of the consumer,) and consumer sentiment waning, it is surprising the markets are still holding up as well as they are. As long as the markets can maintain support about 2125, the bull market is still in play, but at this point, not by much.
More importantly though, despite the ongoing defense of support at current levels, the deterioration in momentum and price action has now triggered intermediate and longer-term “sell signals” as shown below.
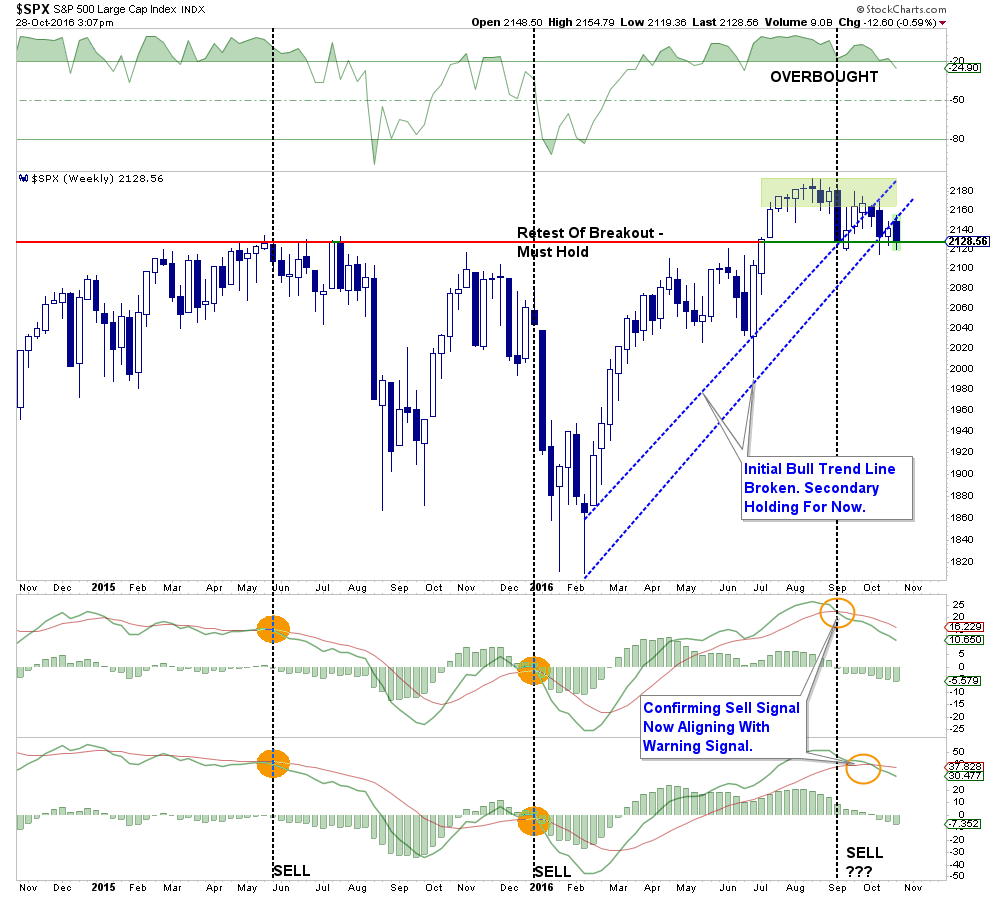
Importantly, notice that both of the previous bullish trend lines (depending on how you measure them) have now been violated. Previously, when both “sell signals” have been triggered, particularly with the market overbought as it is now, the subsequent decline has been rather sharp.

Lastly, as stated above, the 50-dma moving average has begun to trend lower, the downtrend resistance from the previous market highs remains present and the “sell signal” occurring at high levels suggests the risk of a further correction has not currently been eliminated.
As stated last week, and remains this week:
“It is important, as an investor, is not to ‘panic’ and make emotionally driven decisions in the short-term. All that has happened currently is a ‘warning’ you should start paying attention to your investments.”
Just be cautious for the moment.
Economy About To Hit The Dollar “Wall”
Since early May, I have continued to maintain an outlook for a stronger dollar as higher U.S. interest rates continue to attract foreign inflows.
As I wrote several weeks ago:
“As shown below, a stronger dollar will provide another headwind to already weak earnings and oil prices in the months ahead which could put a damper on the expected year-end ‘hockey stick’ recovery currently expected.”

Of course, the real problem of a stronger dollar at this juncture is that it weighs on exports which comprise about 40% of corporate earnings. As I stated last week:
“The dollar rally could be a real problem with respect to the earnings recovery story going into the end of the year. With an already weak economy, a stronger dollar means weaker exports for companies and a drag on corporate profitability.”
The chart below shows the relationship between exports and the dollar.

Of course, despite the “whooping and hollering” over the advance print of GDP at 2.9% on Friday, such exuberance may be a tad premature as the next chart shows the relationship between the dollar and the economy itself.

This is particularly interesting given the recent number of companies trying to blame weak earnings reports on the election. As Paul La Monica wrote this past week:
“This contentious and seemingly never-ending presidential election campaign makes me want to eat more comfort food to boost my spirits.
But maybe I’m alone. Executives from several food companies — as well as other big consumer brands — have warned in recent weeks that the Donald Trump versus Hillary Clinton battle for the White House is actually hurting their results.”
Whether it was the CEO of Dunkin’ Brands (DNKN), which owns both Dunkin’ Donuts and ice cream chain Baskin-Robbins, McDonald’s (MCD), YUM! Brands (YUM) or Popeye’s Louisiana Chicken (PLKI), they all pulled the excuse the election was hurting their results.
As Paul goes on to state:
“Really? It seems hard to imagine that people are passing up the opportunity to have an iced coffee and a cronut or some fried chicken and cheeseburgers just because they are scared of what either a President Trump or Clinton would do to the economy.”
Paul is absolutely right. The poor results from restaurants or consumer good related companies like Apple and Amazon aren’t missing results due to the election, but rather these are early signs of a consumer that is being impacted by they triple whammy of rising borrowing costs, weak wage growth and spiraling health care costs thanks to the “Un-Affordable Care Act.”
Of course, this is clearly seen in the report from the National Restaurant Association as consumers are forced to choose between eating out or paying for health care costs.
“Due in large part to declines in both same-store sales and customer traffic, the National Restaurant Association’s Restaurant Performance Index (RPI) fell below 100 in August.”

“The RPI fell below 100 for the first time in eight months, as a result of broad-based declines in the current situation indicators. Restaurant operators reported net declines in both same-store sales and customer traffic in August, along with corresponding dips in the labor indicators.
The RPI is constructed so that the health of the restaurant industry is measured in relation to a steady-state level of 100. The Restaurant Performance Index consists of two components – the Current Situation Index and the Expectations Index. Current Situation Index Fell 1.9 Percent in August to a Level of 98.6; Expectations Index Edged Down 0.2 Percent to a Level of 100.6.”

Related Posts
 7 Dividend Stocks That Promise Stability And Growth
 AUD/USD Forecast Apr. 16-20 – A Bit Overbought, Jobs In The Limelight
- Crypto Stories: How Altcoin Daily built a platform for millions of crypto enthusiasts
- The Second Dumbest Kind Of Money Is Pouring Into Stocks — “With A Vengeance”
- The Scariest Day
- After A Manic Trading Week Here’s What To Expect Next


Leave A Comment