
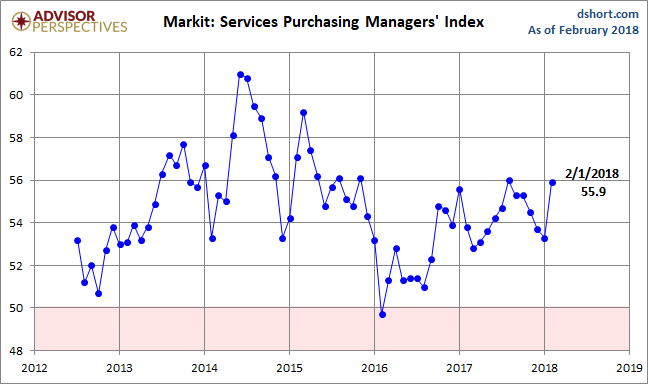
The February US Services Purchasing Managers’ Index conducted by Markit came in at 55.9 percent, up 2.6 from the final January estimate of 53.3. The Investing.com consensus was for 55.9 percent. Markit’s Services PMI is a diffusion index: A reading above 50 indicates expansion in the sector; below 50 indicates contraction.
Here is the opening from the latest press release:
Business activity across the U.S. service sector expanded sharply in February, according to the latest PMI data. The upturn in output accelerated to the fastest since August 2017. In addition, greater client demand led to a steep rise in new business, which rose at the strongest pace in almost three years. Capacity pressures intensified as a result of the upswing in demand, with backlogs of work accumulating to the greatest extent since March 2015.
Meanwhile, rates of both input and output price inflation accelerated, with the former reaching the fastest since June 2015. [Press Release]
Here is a snapshot of the series since mid-2012.
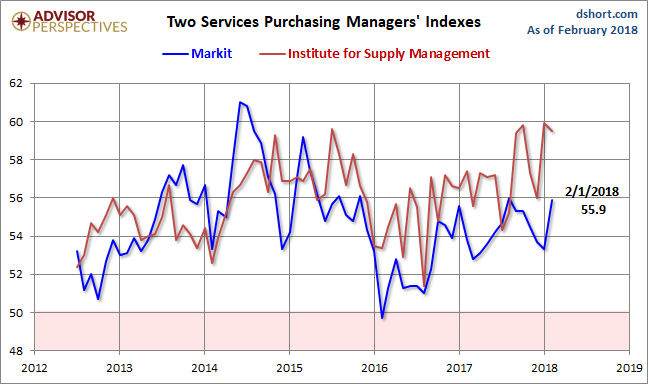
Here is an overlay with the equivalent PMI survey conducted by the Institute for Supply Management, which they refer to as “Non-Manufacturing” (see our full article on this series here). Over the past year, the ISM metric has been significantly the more volatile of the two.
The next chart uses a three-month moving average of the two rather volatile series to facilitate our understanding of the current trend. Since early in 2016, the ISM metric has shown stronger growth than the Markit counterpart. It will be interesting to see how these two indicators play out for the remainder of 2017.
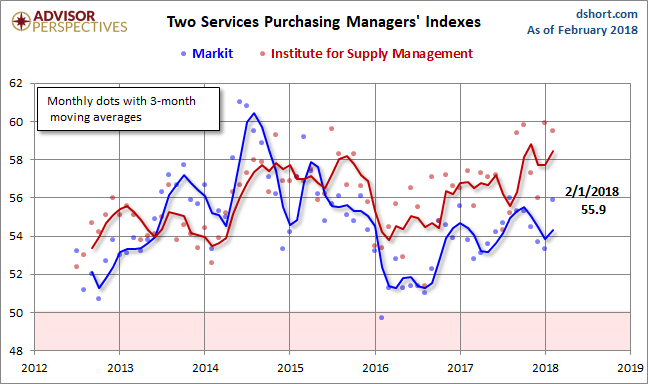
Both series weakened since 2015 and saw an uptick in the latter half of 2016. The interim three-month moving average of the Markit Services index peaked in August of 2014. The ISM index peaked in September of 2015. The two were fairly closely aligned at the beginning of 2016, but they diverged early with the Markit index signaling noticeably weaker growth.


Leave A Comment