Trump’s steel tariff announcement yesterday sent US equities reeling on trade war fears. A trade war would presumably impact the largest global companies much more than smaller cap, more domestically-oriented ones.In terms of stock price performance, it seems that investors agree with this presumption.
We ran our decile analysis on the S&P 500 based on market cap to see how the largest vs. smallest stocks in the index have performed during the sell-off that began on Tuesday. To run the analysis, we broke the index into deciles (10 groups of 50 stocks each) based on market cap, and then we calculated the average performance of the stocks in each decile since Monday’s close.
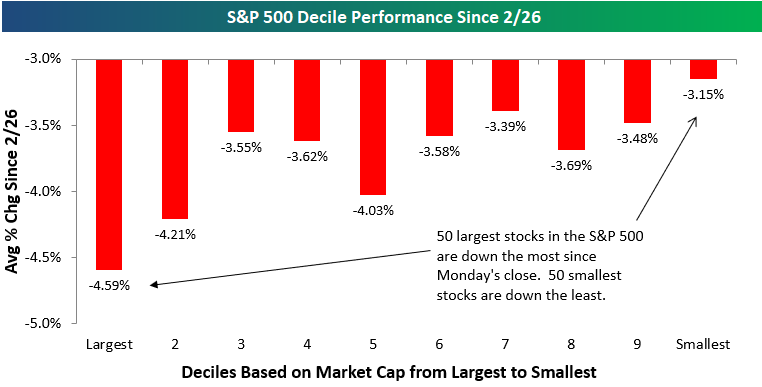
As shown below, the 50 largest stocks in the S&P 500 are down an average of 4.59% during this sell-off, which is easily the worst performing decile of the group. The average stock in the S&P 500 is down 3.73% since Monday’s close, so the 50 largest stocks are underperforming the average by 86 basis points. Conversely, the 50 smallest stocks in the S&P are down just 3.15% during the sell-off, which is the best performing decile of the group.
Given that the S&P 500 is a market cap weighted index, the largest stocks have a bigger impact on its price movement. When the largest stocks get hit the hardest as has been the case on this trade-war sell-off, it weighs heavily on the S&P. But on an equal-weighted basis, things don’t look quite as bad.


Leave A Comment