
Remember how mining stocks soared on Valentine’s Day and how we wrote that a rally is not necessarily bullish? Guess what – this rally has been more than erased. Miners not only closed below the February 14th opening price, but also below the February 13th and 12th closing prices. Mining stocks big rally turned out to be nothing more than just a regular 50% retracement during a decline – something that we saw many times in the past and that we described as likely. But, since the rally was rather inconsequential, then perhaps the decline is inconsequential as well?
Not likely.
It’s not likely because of the context. Gold is still relatively close to its recent high, but mining stocks are very close to their recent low. The latter are underperforming, and Valentine’s Day rally was just a verification of the breakdown in the HUI to gold ratio. Let’s take a look at the details, starting with the currency market (charts courtesy of http://stockcharts.com).
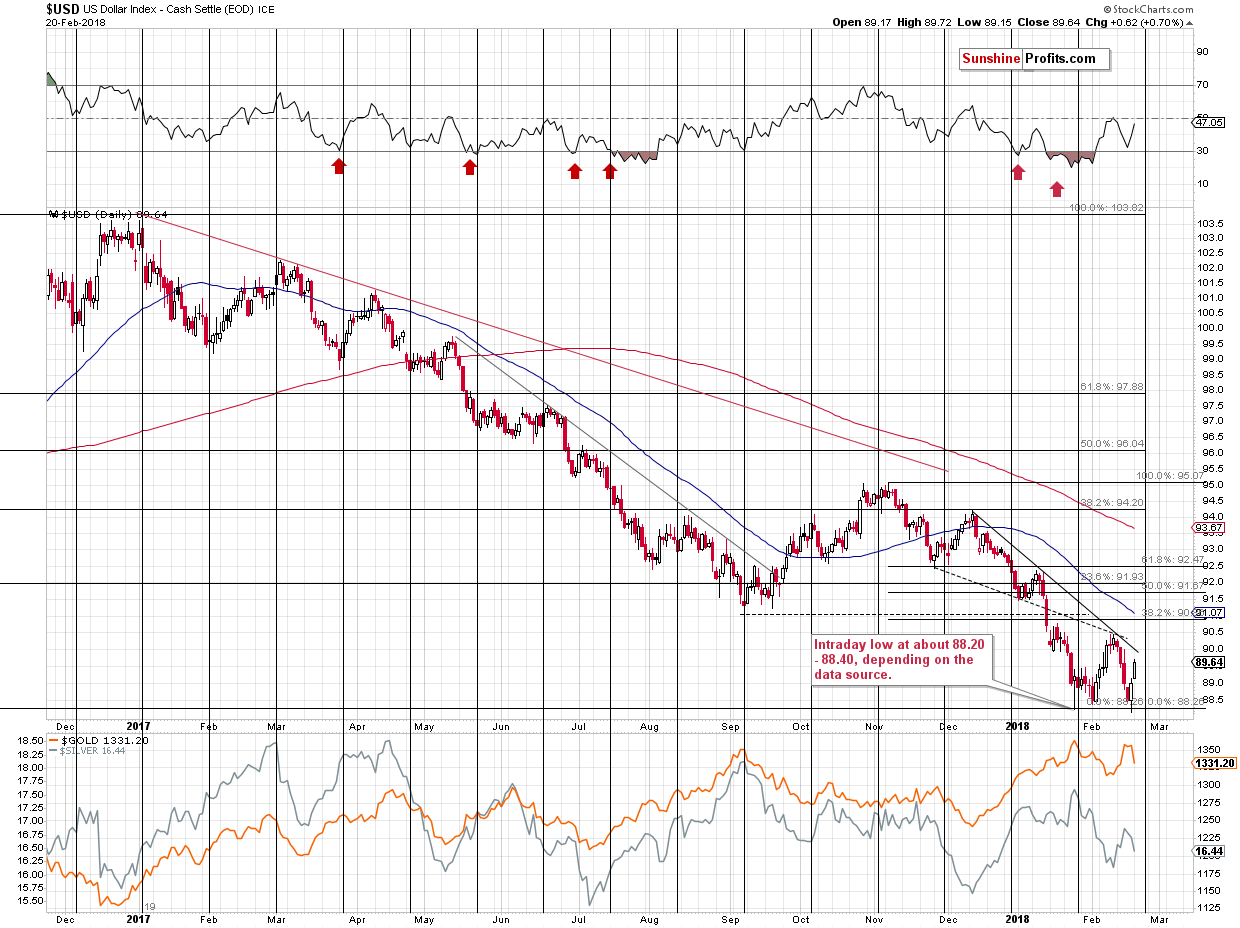
During Friday’s trading, The USD Index moved very insignificantly below the previous 2018 low and rallied back up, invalidating almost all breakdowns below important support levels. The remaining breakdown was invalidated yesterday in a clear way, so the outlook improved further.
The chart above shows how significant the mentioned support levels actually are. Key tops and key Fibonacci retracements based on the key price extremes. Each of them is important and their combination is even more important. The same goes for the invalidation of breakdowns – the implications are bullish.
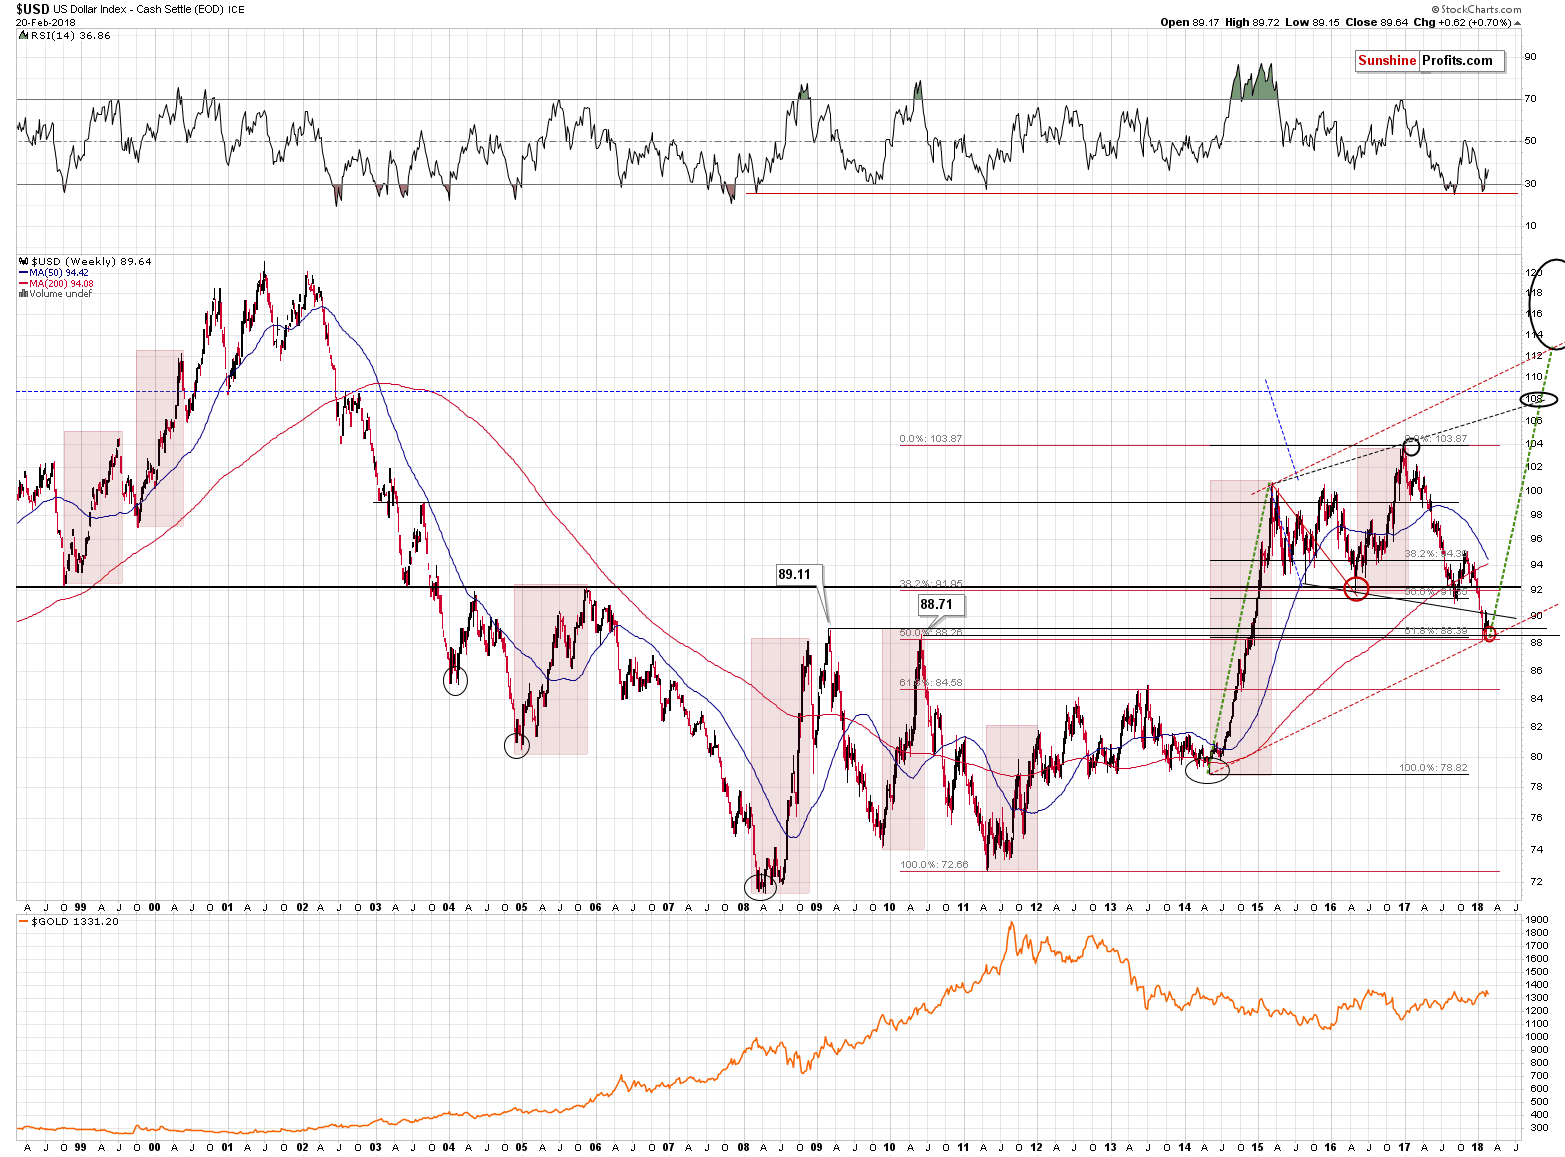
Please note that earlier this year the USD Index broke below the declining support / resistance line based on the mid-2015 and 2016 lows and this breakdown was verified recently. This is a bearish technical development, however, the combination of the 2009 and 2010 tops along with 2 major retracements based on major extremes (marked with red and black on the above chart) is much stronger than the above-mentioned declining line. The reason is that the mid-2015 and 2016 lows are less prominent than the 2009 and 2010 tops and the line based on the former is not strengthened by key Fibonacci retracements, while the latter is.
Consequently, the invalidation of breakdowns below the key, long-term support levels is far more important than the declining shorter-term line. That’s why all in all the outlook is bullish, but not bearish. At the moment of writing these words, the USD Index is trading at 89.82, so it’s very close to the above-mentioned line – it could even be the case that USD breaks decisively above 90 (the above-mentioned line is currently a bit above 90) later today. Actually, we hope that the 90 level doesn’t give up without a fight, but we expect that whether it happens shortly or in a week or so, the decisive breakout above 90 will be seen followed by a bigger rally.


Leave A Comment