By any measure, the stock market is expensive. But the market is a collection of stocks. Instead of focusing on the market, we can also analyze the stocks that make up the market.
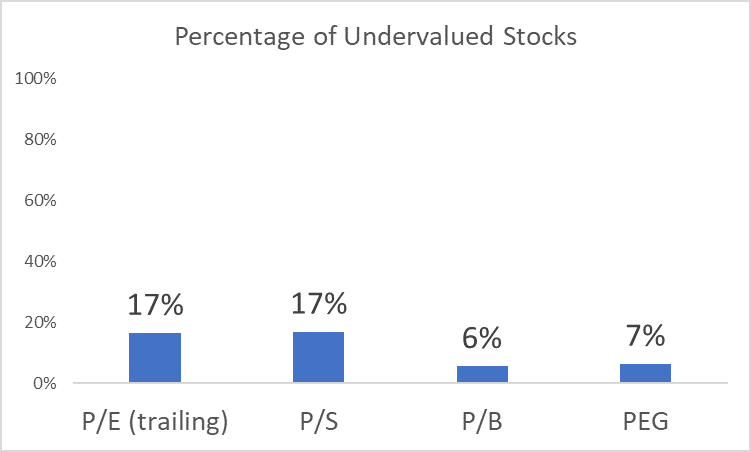
The chart below shows the number of individual stocks that are undervalued. As you can see, there aren’t many cheap stocks.

This chart is based on the stocks that make up the S&P 500 Index. Using all the stocks in the market provides similar results.
No matter how you measure value, less than 20% of the stocks in the market offer value.
I define value as a price-to-earnings (P/E) ratio below 15. For the price-to-sales (P/S) ratio, I consider a stock cheap with a P/S ratio below 1. That same number is used for the price-to-book (P/B) ratio and the PEG ratio.
The PEG ratio is a forward-looking valuation tool. It compares the P/E ratio to the growth rate of earnings. This technique recognizes that growth deserves a premium in the market.
But it doesn’t improve the valuation picture. Even using PEG ratios, a tool based on projected growth, more than 90% of the stocks in the market are overvalued.
When the market looks like this, it’s time to raise cash.


Leave A Comment