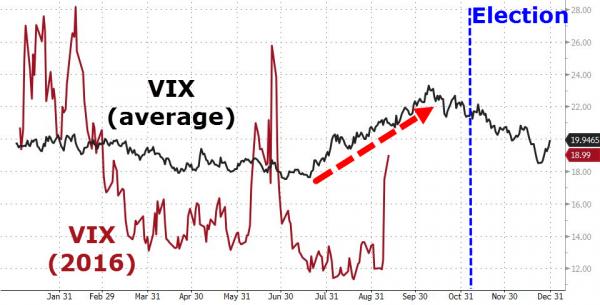
It was just a matter of time, noted one veteran trader, as VIX smashed higher out of its comfort zone on Friday. This is not completely unexpected as seasonally VIX has bled lower into July then risen notably into November. This year that lines up perfectly withe election uncertainty and as the trader warned, “there’s more to come…”

h/t TopDown
As we noted previously, to get a historical perspective on prior periods of similar low-volatility market behavior, we pulled the daily data for the CBOE VIX Index back to 1990. Since the VIX is closely tied to actual volatility, this is a useful measurement of both current price action and expected near term moves in the S&P 500. To get a sense of “Structural” volatility expectations through time, we ran a historical one year average VIX level using the daily close for the VIX. The chart with our findings (1991 to present) is in the attachment to this note, and here is what the data tells us about prior periods of low actual/expected volatility:
Even though the long run average of the VIX is 20 (19.74013, to be exact), there are long periods of time when it can trade consistently below 15 on an average annual basis. That’s not quite one standard deviation (that is 8, or 7.9867 if you want to be precise), but far enough away from the long run mean to be noticeable.
The three times this has occurred since 1990 are:
- February 1993 to September 1996, when it averaged 13.4 over this 43 month period.
- February 2005 to October 2007, with an average of 13.2 over 32 months.
- August 2013 to July 2015, with an average annualized reading of 14.4 over 23 months.
Once the annual average VIX crosses back over 15 on its way higher, it is years before this measure of volatility begins to decline again.

The picture here is essentially one of a pendulum of market volatility, swinging back and forth in very long movements. Volatility can remain suppressed for years, and we outlined 3 periods where average annual VIX readings are consistently below 15. The last one of these ended a little over a year ago. Yes, it may feel like we are still in it (today’s VIX close was 12.3) but recent bouts of market churn (China last year, Brexit earlier in 2016) are holding those averages above 15. Today’s one year average, for example, is 17.2.


Leave A Comment