
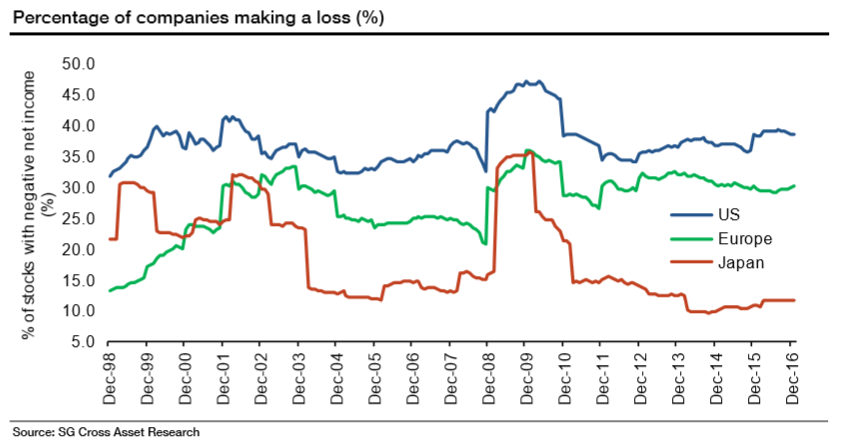
Earlier this week I covered research from analysts at SocGen, showing that despite the market’s recent record run, almost 40% of US companies are currently still loss-making and even though both the S&P 500 and MSCI world indices are trading at record levels the average MSCI stock is down 26% from its all-time high. The indices’ have been powered to record highs by just 15% of equities.
If these figures aren’t enough to put you off buying single stocks, then research by Arizona State Professor Hendrik Bessembinder should seal the deal.
Most Stocks Produce Returns Of Less Than 1.5% Per Annum
According to the professor’s research, 58% of stocks don’t even outperform a Treasury bill. This revelation is based on the assessment of the returns of 26,000 stocks over the nine-decade period from 1926 to 2015. During this period, just 4% of equities accounted for all $31.8 trillion of gains. To put it another way, these figures show 96% of all stocks listed during the period did nothing but lose money in real terms for investors.
The study points out that the average monthly return for US stocks from 1926 to 2015 was 1.31% with compared with an average monthly T-bill rate of 0.38%. On an individual basis, less than half of monthly stock returns were positive and of the 4% of equities that were responsible for the majority of the markets gains over this period, 86 generated half of the returns. Exxon Mobil alone accounted for 3% of the wealth created over the period and Apple accounted for about 2%.
What’s even more depressing for the average investor is that unprofitable companies have tended to perform better than their profitable counterparts. If you had purchased the 100 companies in the S&P 500 with the highest profit margins back in 2000 while shorting the hundred companies with the lowest profit margins, by 2015 you would have lost around 50% of your capital.


Leave A Comment