September 13, 2017 concludes the 180-day lockup period on MuleSoft Inc. (NYSE: MULE).
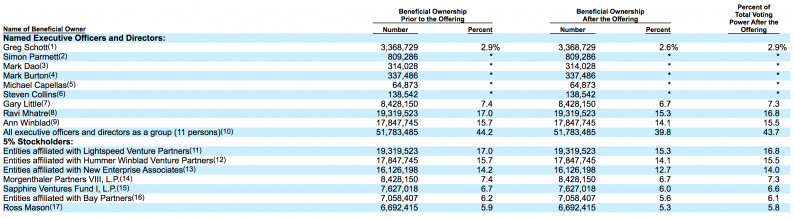
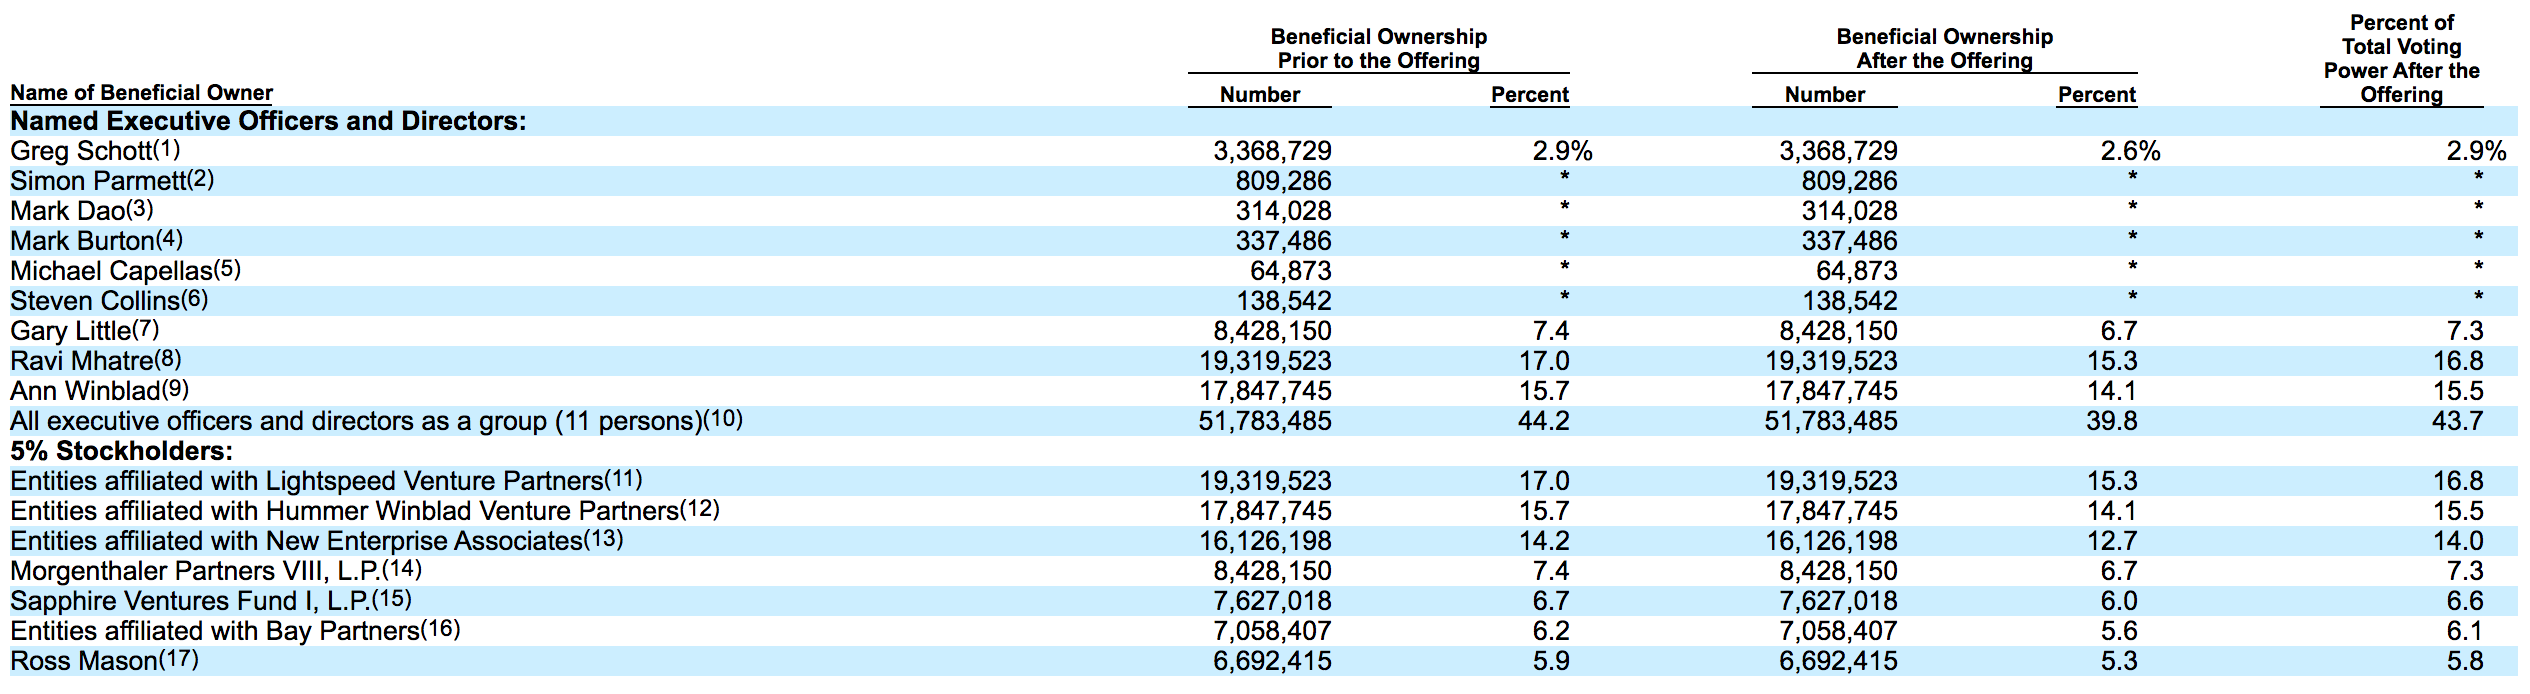
When the lockup period ends for MULE, its pre-IPO shareholders, directors and executives will have the chance to sell their 112.9 million shares for the first time since the IPO. The potential for a sudden increase in stock available in the open market may cause a significant decrease in the price of MuleSoft shares.
Currently, MULE trades in the $21.50 to $23 range, well above its IPO price of $17. This represents an increase of ~27%.
Our firm’s research has shown significant price declines surrounding many IPO lockup expirations, particularly for firms like MULE where a large number of shares – here, approximately 89% – are restricted. Additionally, VC investors tend to be particularly eager to sell once restrictions are lifted.
(Source: S-1/A)
Business Overview: Provider of the Anypoint Platform
MuleSoft owns and operates its Anypoint Platform, which integrates and connects applications, devices, and data sources. Clients may use the platform either on-site or access it via the cloud. The hybrid integration platform enables clients to connect their applications, devices, and data into a network with pluggable APIs rather than gluing them together with customized integration code.
This means that additional applications can be built rapidly with building blocks, giving organizations the ability to scale, innovate, and change applications, which prevents bottlenecks. The company was formerly known as MuleSource Inc. and changed its name to MuleSoft, Inc. in September 2009. MuleSoft, Inc. was incorporated in 2006 and is headquartered in San Francisco, California.
Financial Highlights
MuleSoft reported the following highlights for the second quarter of fiscal 2017, which ended on June 30, 2017:


Leave A Comment