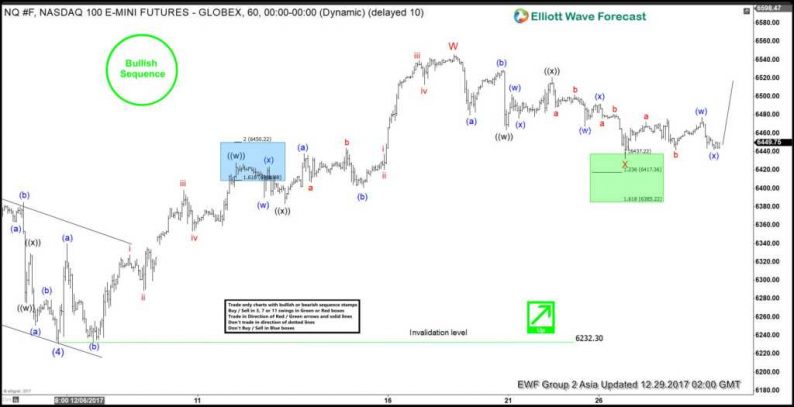
The Nasdaq short-term Elliott Wave view suggests that the Index remains bullish as far as pullbacks stay above Intermediate wave (4) at 6232.3. The rally from intermediate wave (4) low unfolded as a double three Elliott Wave structure where Minor wave W ended at 6545.75 and Minor wave X proposed complete at 6432.25 in the green box. The internal of Minor wave W unfolded as a double three Elliott Wave structure where Minute wave ((w)) ended at 6427.75, Minute wave ((x)) ended at 6383, and Minute wave ((y)) of W ended at 6545.75.
Internal of Minor wave X unfolded as a double three Elliott Wave structure where Minute wave ((w)) ended at 6463.25, Minute wave ((x)) ended at 6520.75, and Minute wave ((y)) of X ended at 6432.25. Near-term, while dips stay above 6432.25, but more importantly as far as pivot at 12/5 low (6232.3) stays intact, expect Index to extend higher. Unless already long with a risk-free trade from the green box area, we prefer to wait for the Index to break above Minor wave W at 6545.75 before buying the dips again. Until the Index breaks above Minor wave W at 6545.75, a double correction in Minor wave X still can’t be ruled out.
If the Index breaks below 12/26 low (6432.3) from here, then it could either form a triple three or double three correction from 12/19 peak. In the case of a triple three correction, Index should then extend lower to 6371 – 6391 area to end Minor wave X before the rally resumes. In the case of a double three correction, then Index can go to as low as 6234 – 6361 to end Minor wave X before buyers appear for at least a 3 waves bounce.
Nasdaq 1 Hour Elliott Wave Chart


Leave A Comment