
We’re telling a story in two charts today. First, the relationship between median new home sale prices in the U.S. and median household income, from December 2000 through May 2017.

In the chart above, we see that after having flatlined for the first four months of 2017, the first estimate of median new home sale prices appear to have significantly surged in May 2017. We should note that this data will be revised three more times in the next three months before being finalized.
In the chart below, we’ve taken all of the median new home sale price data we have and have divided it by all the median household income data that we have, which extends back to 1967 (the new home sale price data itself goes back further, to January 1963).
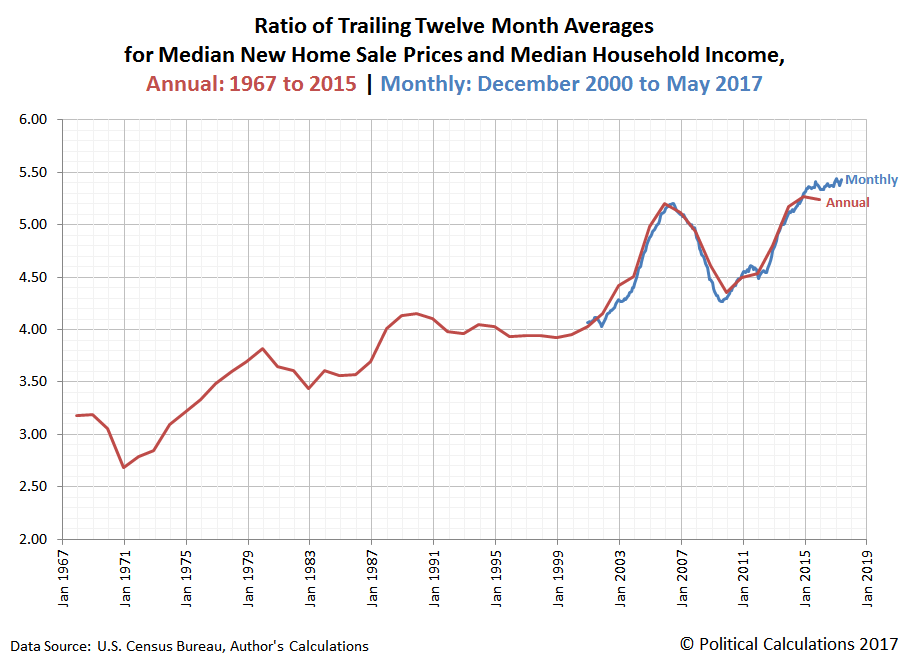
Here, we see that median new home sale prices are approaching 5.5 times the level of median household income in the U.S., indicating that homes in the U.S. are becoming less affordable and, in fact, have never been less affordable for the median income earning U.S. household than they are today.


Leave A Comment