
In August, the New York Fed released a new update on household debt today showing record levels. What does it imply for the gold market?
On surface, the report about the household debt is scary, as the total household debt rose by $114 billion (0.9 percent) to $12.84 trillion in the second quarter of 2017. This increase put overall household debt $164 billion above its peak in the third quarter of 2008, and 15.1 percent above its trough in the second quarter of 2013. However, the assets surged as well. Hence, the household net worth is at a record high, as the chart below shows.
Chart 1: Households liabilities (blue line, left axis, $bn) and net worth (red line, right axis, $bn).
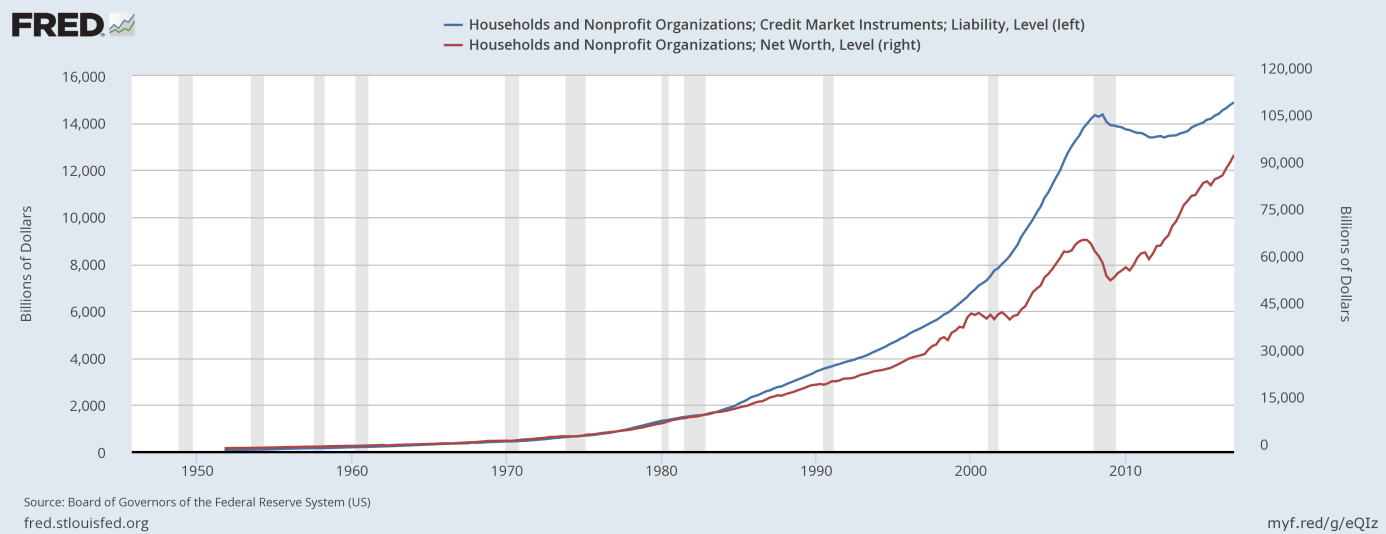
Surely, it should not comfort investors, as the net worth also peaked before the burst of the financial crisis of 2007-2009. However, what is important is the fact that household debt as a share of GDP has fallen dramatically in the last few years, as one can see in the chart below.
Chart 2: Household debt as a percent of GDP (red line, right axis) and the household debt service payments as a percent of disposable personal income (blue line, left axis) since the 1980s.
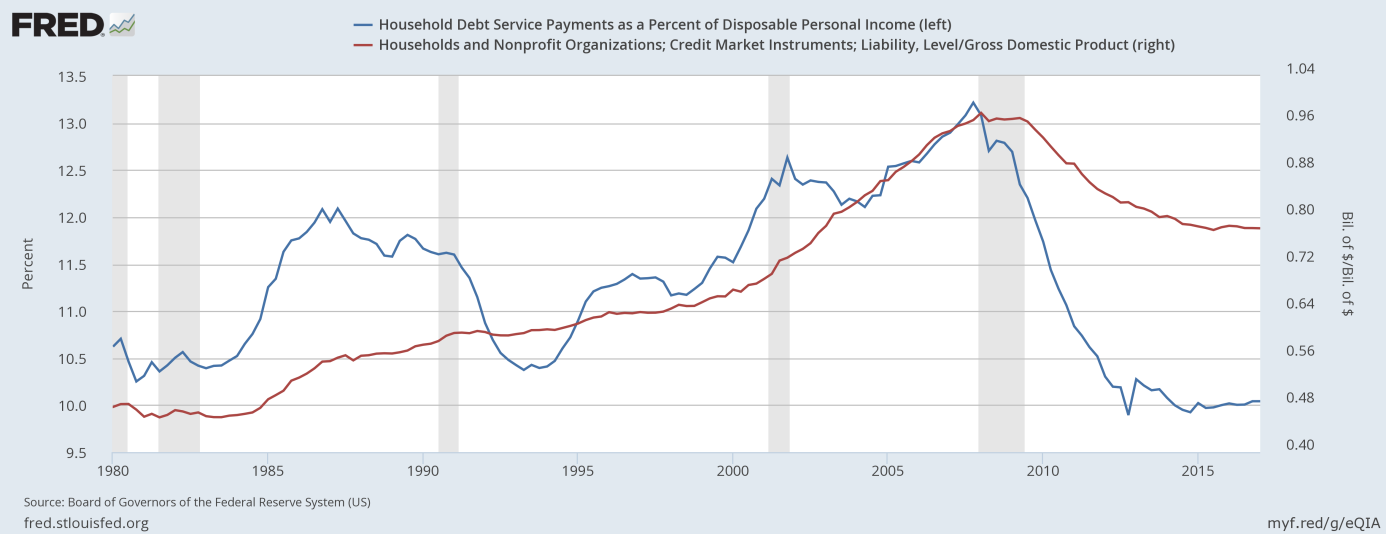
Please note that the household debt service payments also decreased significantly as a percent of disposable personal income. This chart is, thus, very important. It shows that the households have been deleveraging since the Great Depression, which explains the sluggish growth in the recent years. It is difficult to grow like crazy when household reduce their indebtedness. Moreover, the share of the household debt as a percent of the GDP is much lower than before the financial crisis of 2007-2009, so their financial condition is much better. Moreover, the quality of the new debt has also improved. It implies that the current macroeconomic outlook is much healthier and that the next crash is not imminent. It is bad news for the doomsayers and gold as a safe-haven, but good for the U.S. economy.


Leave A Comment