
Written by John Lounsbury and Steven Hansen
The headlines say new home sales improved from last month (however the last few months data was revised downward). The rolling averages smooth out much of the uneven data produced in this series – and this month there was a deceleration in the rolling averages.

As the data is noisy, the 3 month rolling average is the way to look at this data. This data series is suffering from methodology issues. Econintersect analysis:
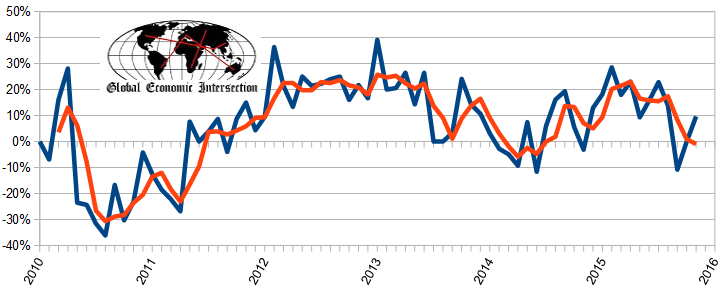
Unadjusted Year-over-Year Rate of Growth – Sales (blue line) and 3 1month rolling average of Sales (red line)
US Census Headlines:
The quantity of new single family homes for sale remains well below historical levels.
Seasonally Adjusted New Homes for Sale

As the sales data is noisy (large monthly variations).
Year-over-Year Change – Unadjusted New Home Sales Volumes (blue line) with zero growth line emphasized
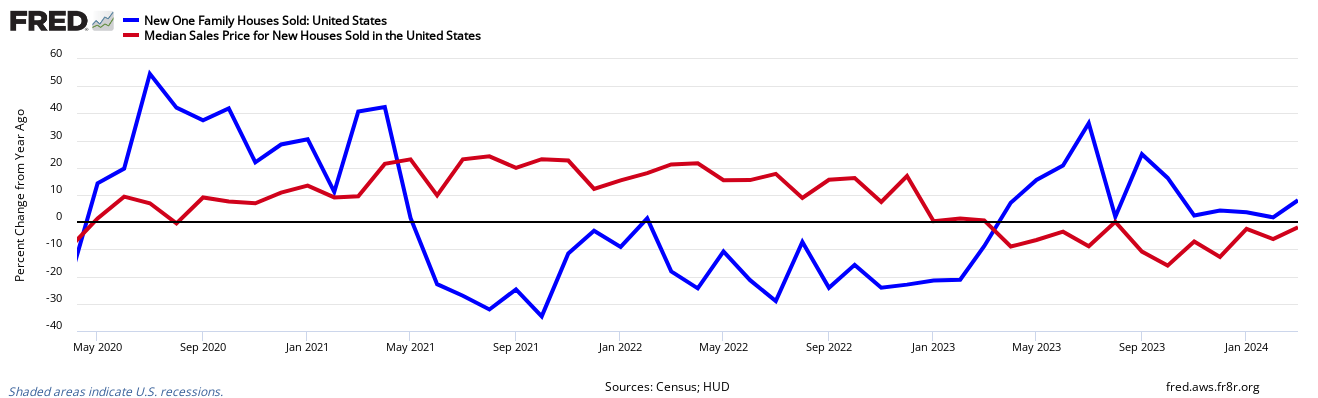
The headlines of the data release:
Sales of new single-family houses in November 2015 were at a seasonally adjusted annual rate of 490,000, according to estimates released jointly today by the U.S. Census Bureau and the Department of Housing and Urban Development. This is 4.3 percent (±11.9%)* above the revised October rate of 470,000 and is 9.1 percent (±20.9%)* above the November 2014 estimate of 449,000.


Leave A Comment