
from the American Chemistry Council
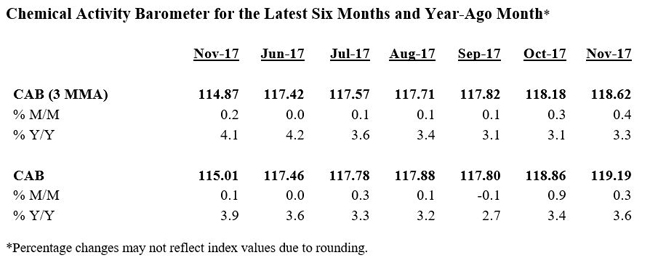
The Chemical Activity Barometer (CAB) notched another solid increase over October’s reading both on a three-month moving average (3MMA) basis and an unadjusted basis.

The CAB was up 0.4 percent and 0.3 percent, respectively. The increases continued a bounce back from the effects of Hurricanes Harvey and Irma. Compared to a year earlier, the CAB is up 3.3 percent on a 3MMA basis, a pace that continues to suggest further gains in U.S. commercial and industrial activity into 2nd quarter 2018.
The Chemical Activity Barometer has four primary components, each consisting of a variety of indicators: 1) production; 2) equity prices; 3) product prices; and 4) inventories and other indicators.
In November, three (equity markets were soft) of four broad categories continued their climb from the effects of September’s historic storms. October’s diffusion index remained at 65 percent. The diffusion index is the number of positive contributors relative to the total number of indicators monitored.

z chemical_activity_barometer.png
Caveats on the Chemical Activity Barometer (CAB):
The definition of the CAB:
The Chemical Activity Barometer is a leading economic indicator derived from a composite index of chemical industry activity. The chemical industry has been found to consistently lead the U.S. economy’s business cycle given its early position in the supply chain, and this barometer can be used to determine turning points and likely trends in the wider economy. Month-to-month movements can be volatile so a three-month moving average of the barometer is provided. This provides a more consistent and illustrative picture of national economic trends.
Applying the CAB back to 1912, it has been shown to provide a lead of two to fourteen months, with an average lead of eight months at cycle peaks as determined by the National Bureau of Economic Research. The median lead was also eight months. At business cycle troughs, the CAB leads by one to seven months, with an average lead of four months. The median lead was three months. The CAB is rebased to the average lead (in months) of an average 100 in the base year (the year 2012 was used) of a reference time series. The latter is the Federal Reserve’s Industrial Production Index.


Leave A Comment