Oh snap: An exclamation of dismay or disbelief, surprise, or joy.
The IPO of Snap—apparently a “camera company”—was the biggest news in financial markets last week. The skeptics are many, mostly emphasizing that Snap is loss-making and that its valuation based on forward earnings—never mind trailing earnings of which there aren’t any—is ludicrous. The market begged to differ, though. Snap was introduced to investors at $17 a share, but immediately traded at around $24 before closing at $27, up a cool 58%, at the close on Friday. Bloomberg editor, and FinTwitter extraordinaire, Joe Weisenthal stated the obvious when he remarked that:
Indeed. I don’t plan to invest in Snap and I must admit that its valuation is beyond my comprehension. I wouldn’t call it dismay, but certainly disbelief. It wouldn’t be the first time that fundamental investors were wrong about a tech unicorn, though, and it won’t be the last. Matt Levine keeps his cool, and does a good job explaining the ins and outs of the story.
Looking for an excuse to sell
The uproar over the Snap IPO is a good metaphor for the growing disdain in some parts of the market towards the ever-rising stock market. I explored the uber-bearish meme here, and it remains strong as ever. The bears have thrown everything at the market; extended valuations, stretched technicals, a looming “Trump disappointment”, a hard landing in China, or a breakup of the Eurozone. The louder their objections, though, the stronger the rally has become. I have found myself in a similar trap since Q4, when my models started to suggest that I should fade the rally in equities. It has been a costly position in terms of relative performance, but at least I haven’t suffered the slings and arrows of those who have been short outright.
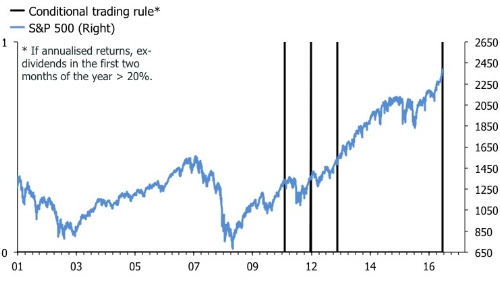
Bears will hope that the tide is turning in their favor, though. Volatility has crept higher, and the adage that “nothing goes up in a straight line forever” also appears apt at the moment. The S&P 500 was up 6% in the first two months of 2017, a hefty 36% annualized, and it isn’t a huge leap to conclude that this momentum won’t be sustained. But this piece of information alone isn’t a good market-timing tool. The chart below shows previous occasions since 2000 when the S&P 500 was up more than 25% annualized in the first two months of year.

I was actually surprised to see that this hadn’t happened once in the bull market from 2002 to 2007. It has occurred three times since 2008. In 2011 and 2012, equities did eventually drop sharply after their strong start to the year, but in 2013 the elevator kept on going up. Never mind the fact that sample size of three is not statistically significant, the idea that the market must falter because it has gone up a lot isn’t really a good argument. Naturally, if you want scary charts, there are plenty to choose from. The following chart shows the Rydex bulls-to-bears ratio, which is sporting an ugly double-top, consistent with the peak before the market swooned in the beginning of 2016.


Leave A Comment