![]() Freepik Oil chart analysisThe previous week was positive for the oil price by returning above the $75.00 level. On Friday, bullish saturation occurred, and the price retreated to the $73.40 level. Today is a non-working day, and we expect the continuation of this pullback tomorrow. The price could test the $73.00 level and the EMA50 moving average. The inability to hold on there leads to falling below and looking for support at the next lower levels. Potential lower targets are $72.50 and $72.00 levels.We would have to initiate a positive consolidation and move back above the $75.00 level for a bullish option. Then it is desirable to hold on above in order to form a new bottom from which to start further recovery. Potential higher targets are $75.50 and $76.00 levels.
Freepik Oil chart analysisThe previous week was positive for the oil price by returning above the $75.00 level. On Friday, bullish saturation occurred, and the price retreated to the $73.40 level. Today is a non-working day, and we expect the continuation of this pullback tomorrow. The price could test the $73.00 level and the EMA50 moving average. The inability to hold on there leads to falling below and looking for support at the next lower levels. Potential lower targets are $72.50 and $72.00 levels.We would have to initiate a positive consolidation and move back above the $75.00 level for a bullish option. Then it is desirable to hold on above in order to form a new bottom from which to start further recovery. Potential higher targets are $75.50 and $76.00 levels. 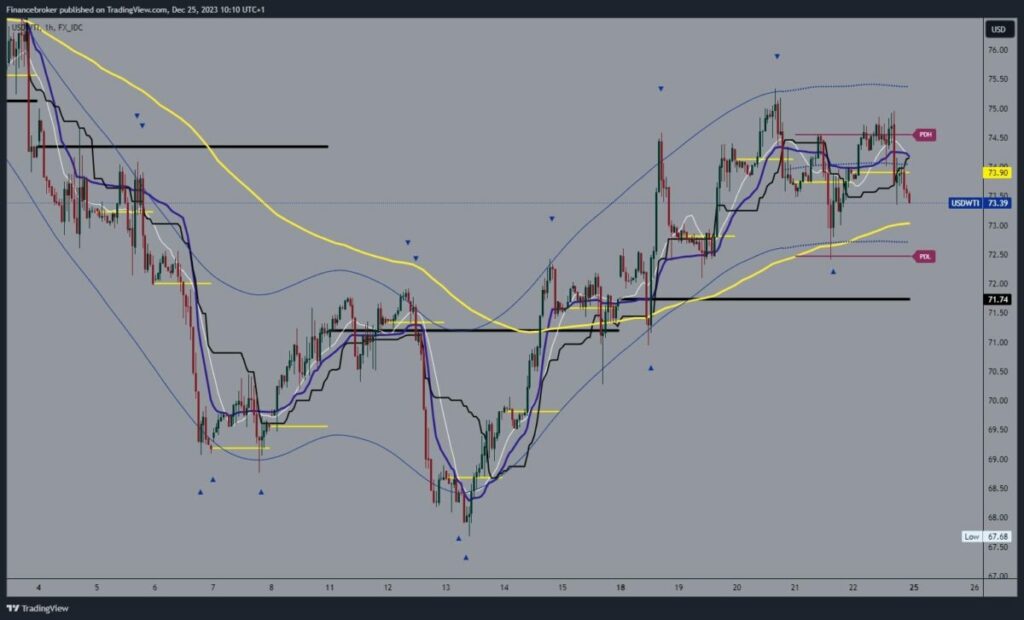 Natural gas chart analysisLast week, we saw the price of natural gas move in the $2.26-$2.44 range. On Friday, the price closed at $2.43, remaining very close to the upper resistance line. After tomorrow’s market opening, a breakout above and the start of a bullish consolidation could easily happen. Then, we would be able to reach the $2.50 level and try to stay around it. Potential higher targets are $2.52 and $2.54 levels.We need a negative consolidation and price pullback to the $2.36 support level for a bearish option. There, we would test the EMA50 moving average. Increased bearish pressure would lead to a drop below and push us towards the lower support zone. Potential lower targets are $2.32 and $2.30 levels.
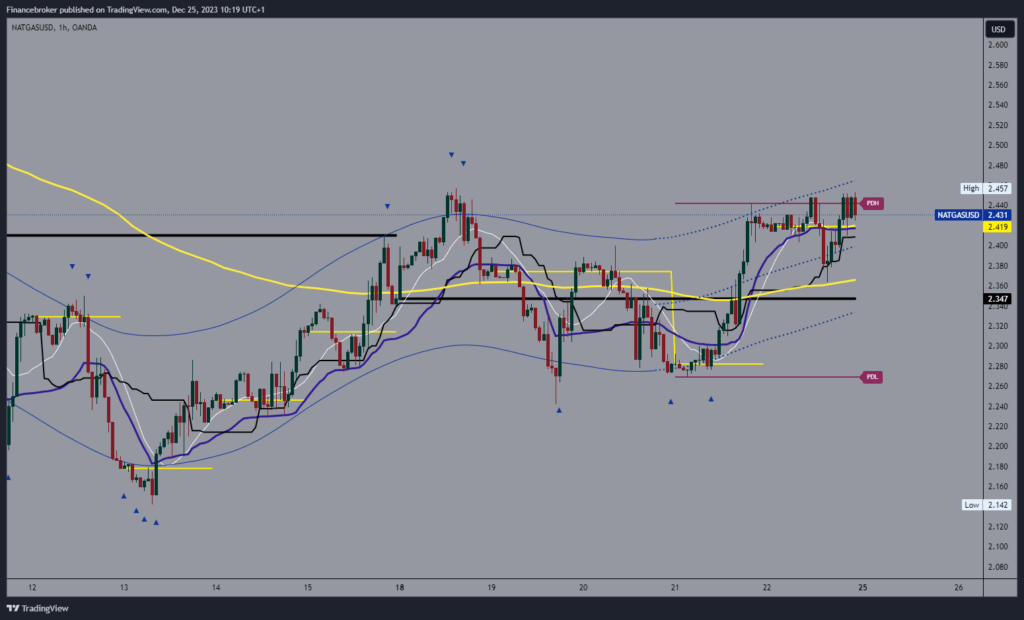 More By This Author:Gold And Silver: Gold Is Holding Above $2050 Level
GBP/USD Forecast: Navigating Key Support Levels
The Rollercoaster Ride: Asia-Pacific Markets React


Leave A Comment