
 FreepikOil chart analysisDuring the Asian trading session, oil prices continued to slide below the $75.00 level. We are currently below the $73.00 level in a bearish consolidation and expect to see a continuation to the bearish side, looking for support at lower levels. Potential lower targets are $72.50 and $72.00 levels. The previous low price of oil was in mid-November at the $72.13 level, and if we break through that level, the price could continue towards the $70.00 level.We need a positive consolidation and a return to the $75.00 level for a bullish option. Then, we would have to stay above that level to form a bottom from which to start the recovery. Potential higher targets are $75.50 and $76.00 levels. The additional average price in the zone is around $76.00 is the EMA50 moving average.
 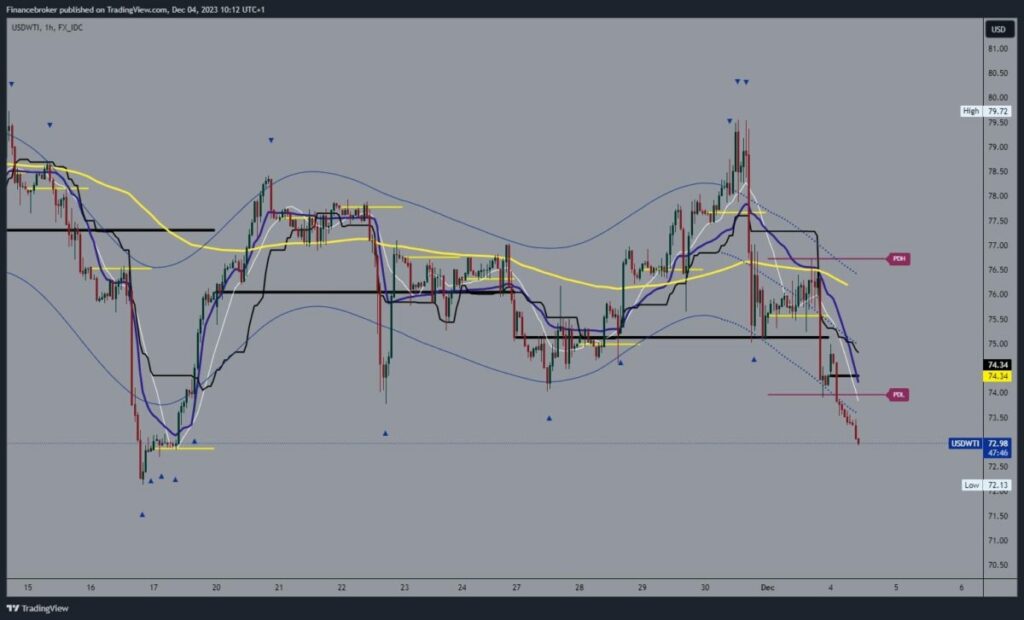 Natural gas chart analysisDuring the Asian trading session, the price of natural gas continued its retreat to a new low this week. A low was formed at the $2.51 level, and we can say that we are now testing the $2.50 support level. The price has been in a bearish consolidation for almost a month. The $2.50 level could be a psychological level below; around it, we could expect to see some struggle to stay above.A break below leads to the formation of a new low, and the potential targets are the $2.45 and $2.40 levels. For a bullish option, we need a positive consolidation and a move above the $2.55 level, and in that way, we would climb above the previous daily low. This would encourage the price to start a recovery and a bullish trend. Potential higher targets are $2.60 and $2.65 levels. We would have additional resistance in the EMA50 moving average around the $2.65 level.
 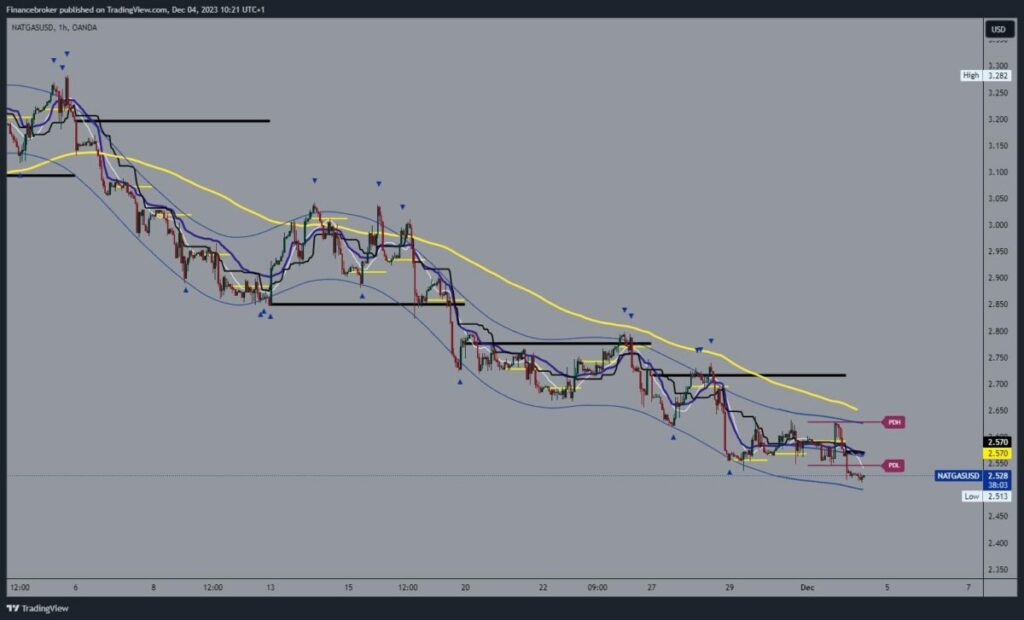 More By This Author:Single Stock Futures In A Changing Market Landscape
Trending Asian Stocks Close Strongest Month Since January
Stock Market Outlook: Assessing Asia’s Economic Pulse


Leave A Comment