
Many gold bulls are frustrated that during last year’s U.S. dollar decline, the precious metal didn’t rally more strongly. After all, the U.S. dollar had a terrible 2017.
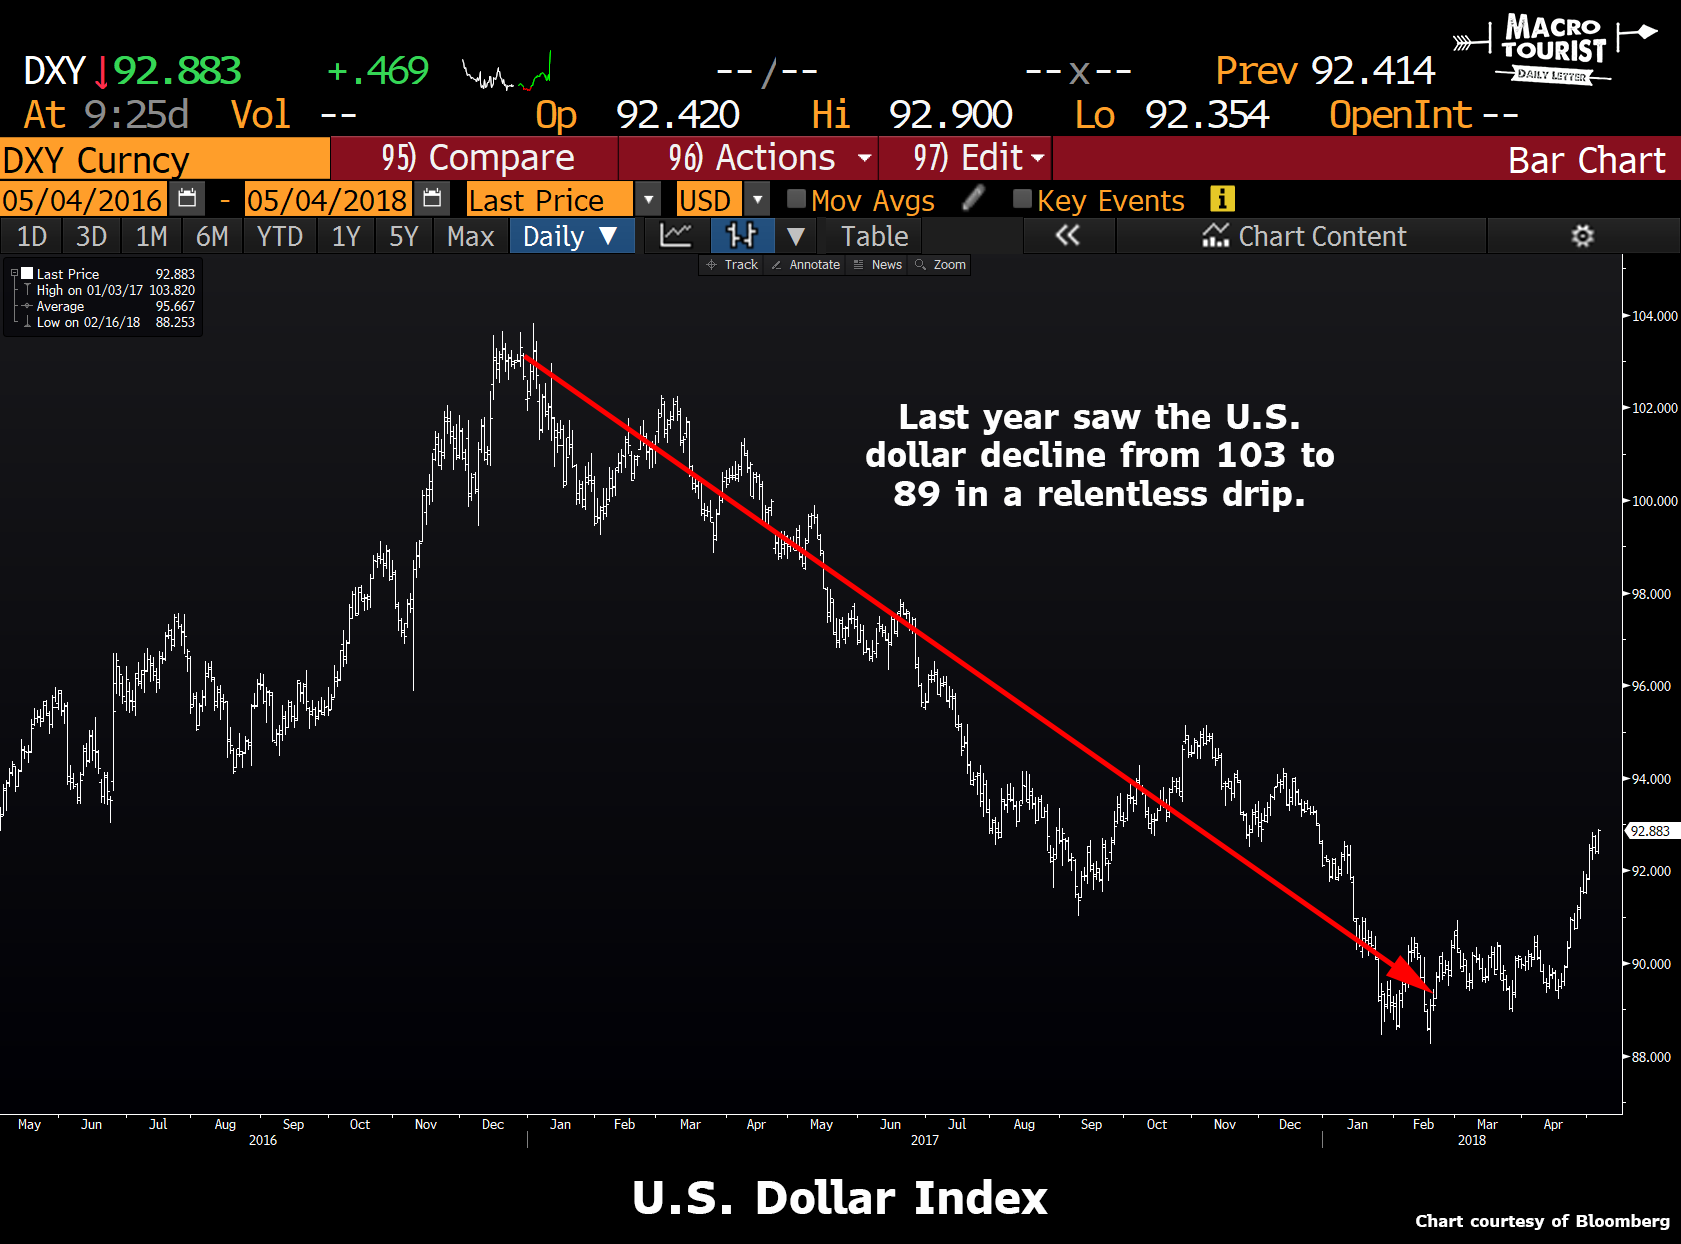
One might assume that this would have been an ideal environment for gold. I have even heard the argument that since gold couldn’t rally more strongly during this period, when the U.S. dollar eventually stops declining, gold will be vulnerable to a big sell off. The logic being that if that’s the best gold can do in a U.S. dollar bear market, it will get crushed in a U.S. dollar bull market.
I like to think about this scenario a little differently.
While most gold bulls are disappointed by the inability of gold to break out, I am heartened by the fact that even with the massive increase in real yields, gold managed to eke out some decent gains.
Most market pundits believe the U.S. dollar is the most important determinant when it comes the gold price. It’s easy to see why. Take a gander at this chart of gold versus the inverted U.S. dollar index:

It sure appears as if gold is merely the inverse of the US dollar index.
Yet I beg to differ. Let’s back up the time frame and look at this chart from a longer term perspective.

Although over the past few years gold has been negatively correlated to the US dollar, during the 2013-14 period, gold plunged $500 while the US dollar was also declining.
Well, you are probably saying to yourself, “it might not be perfect, but it sure seems to track the majority of time – and especially lately.” Yup – can’t say I disagree.
But what if I told you there was an even better asset that explained gold’s movement better? One that even stayed correlated to gold during the 2013-14 plunge?
Have a look at the price of gold versus the inverted US 5-year TIPS yield (the real yield):


Leave A Comment