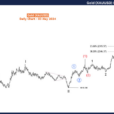
Every investor knows how it is to feel like a fool. We do, for sure if we look back at one of our recent forecasts in which we said that the S&P 500 Is Correcting Towards 2125 Points. The S&P 500 stock index went in the opposite direction, and is now trading at all-time highs.
So, our S&P 500 forecast got invalidated and InvestingHaven’s research team can put this call at the top of its inaccurate market calls.
Well, not THAT fast, is what we would say. It is true without any doubt that this is the most inaccurate call we have made in 2017.
Admittedly, we are way off in terms of timing. We thought the correction would run from September to October / November 2017. Things obviously went in the opposite direction. That is one of the reasons we normally never try to forecast the short term (say on a 3 month period) but we fell into that trap.
However, we are not so sure that this rally has lots of upside potential.
If we go back to the leading indicator we considered to make our bearish call it was based on volatility conditions. We analyzed the long term volatility chart and concluded the following in our article Ignore This Series Of Volatility Warning Signs At Your Own Peril:
Does that suggest that stock markets will crash? That is certainly NOT what we are suggesting. We are saying that historically low volatility will not last long. As volatility picks up, it bears watching which markets and segments do well and which ones sell off. For instance, it could well be that gold will act as a fear trade in the coming months (if that is the case, it will be reverse its long term bear trend into a bull trend) and that bonds will outpeform …
So the message of this chart is that maximum complacency is not bullish, but it triggers smart investors to watch closely what is going to happen as volatility will pick up in the coming weeks and months.
Historically, the volatility index has shown that maximum complacency (which translates into a VIX index falling below 10 points) always resulted in very aggressive rises in volatility in the weeks and months after hitting all-time lows.


Leave A Comment