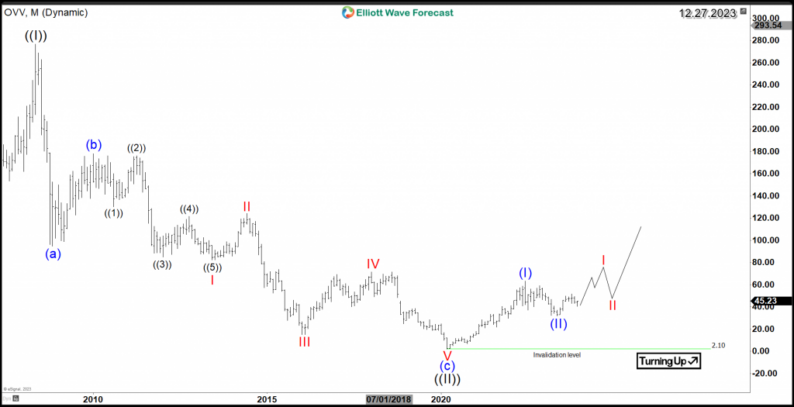
Ovintiv Inc. (NYSE: OVV) is a leading North American exploration and production company. It is an oil and gas producer that explores, develops, produces, and markets natural gas, oil, and natural gas liquids. In this article, we delve into OVV’s technical structure based on Elliott Wave Theory and highlight its potential for further growth.Since its all-time high back in 2008, the stock spent 12 years in decline within a downtrend and lost 99% of its value. However, 2020 marked an important turn for the stock as we’ll see in the following chart :OVV Monthly Elliott Wave Chart 12.27.2023 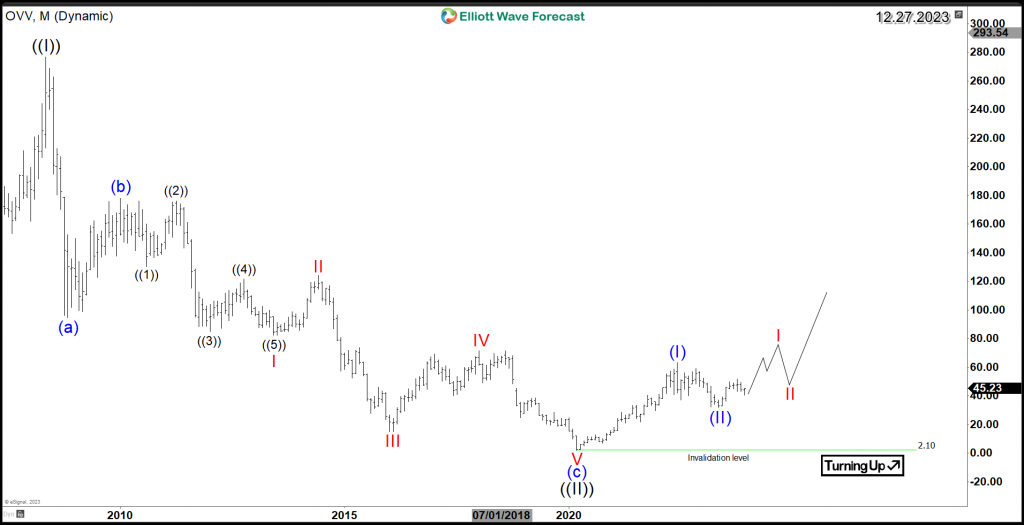 The decline from the 2008 peak of $276 evolved as a 3-wave Zigzag structure. Both waves (a) and (c) unfolded as 5-wave structures, while wave (b) was in 3 waves. The downmove of wave ((II)) is considered to be the entire correction of the Grand Supercycle, and it ended in March 2020 at $2.1. Up from there, the stock saw its initial first 5 waves advance of the new cycle which marked wave (I) at $63.3 and it was followed by wave (II) correction at $32.07.As long as the price stays above that recent May 2023 low then we can expect OVV to resume its monthly move to the upside and it will be important to see a break above June 2022 peak to create a bullish sequence within a higher high and a higher low structure.In conclusion, the long-term technical picture for OVV is turning bullish and investors should be on the lookout for the next investment opportunity within daily cycles.More By This Author:EURCAD: Two Sell Trades Hit TargetsS&P 500 ETF Looking To End Impulsive RallyWest Pharmaceutical Services Bullish Daily Cycle


Leave A Comment