It’s an over obsessed upon commodity, previously hyped for its (Hubbert’s) “peak” status by “experts” like T Boone Pickens and a whole clown show of promoters.
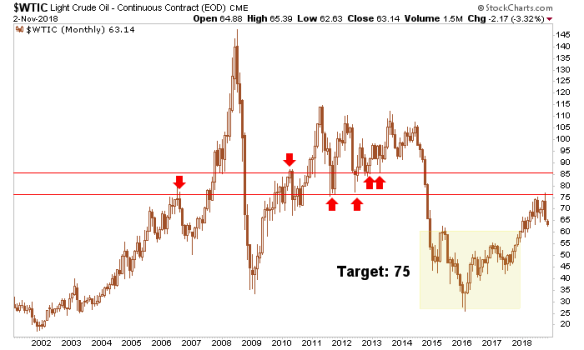
Now WTI Crude Oil has reached a thick resistance zone and may be breaking down from a peak of a whole other kind. Here is the monthly chart we use.

It is preliminary, and one weekend OPEC jawbone could put oil back up in the consolidation. But as of now the price has ticked below the previous 2018 low to close the week. It is not a good look… unless you’re a gold bug, that is. More on that later.

Here is a standard chart to keep an eye on the commodity complex from a big picture perspective. If Crude Oil were to hit the upper end of our resistance target it would break the trend line shown below. But it, Industrial Metals and the CRB index itself are all consolidating downward from these long-term trend lines. It’s a key time for commodities and the ‘inflation trade’. Break out or break down. Those are the options.

Meanwhile, American job creation is brisk and the president is pumping all of this 24/7 leading into the mid-terms. But why are commodities so weak in this fiscally stimulated and reflated economy?
If feels a lot like 2000 right now and last week we drew some important parallels to that time frame (when the gold miners bottomed) and today. That was a view of what the S&P 500 did back then and what it may well be in a process of doing now. All of that came at a time when the economy could not have been better as well.
Think about that. Gold vs. Stock Markets is a macro fundamental indicator for gold stocks. In other words, why buy the miners when stocks are out performing gold? So why again did we follow the 3 Amigos – including Amigo #1 (stocks vs. gold) – so closely? The answer is obvious. No rise in gold vs. stocks… no bull backdrop for the miners.


Leave A Comment