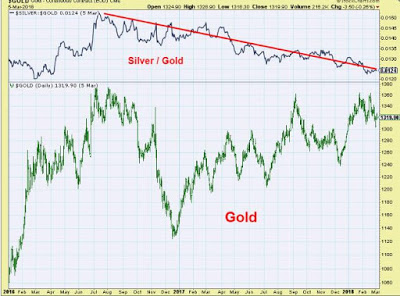
Since the cyclical top in gold prices (July 2016), the silver/gold ratio has been steeply going down:

source: Stockcharts.com
Well,it is not a pattern the gold bugs are looking for. Generally, the silver / gold ratio and gold prices go in tandem – the opposite pattern supports a bearish thesis on precious metals. And since the last top in gold prices the pattern drawn by the silver / gold ratio was typical for a bear market or a consolidation phase in precious metals.
However, today we have the first sign of improvement – the silver / gold ratio is breaking above its resistance (the dotted red line on the chart below):
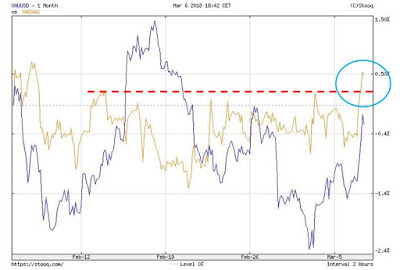
source: stooq.pl
However, the gold bulls should be cautious because gold is still below its strong long-term resistance of $1,350 – $1,350 per ounce. Most recently every time gold was close to this resistance its prices were bouncing off and…dropping. So, be cautious and patient…


Leave A Comment