
In a recent speech, Warren Buffett came down boldly on the side of optimism when it comes to both the economy and financial markets. What he said was “being short America has been a loser’s game…And it will continue to be a loser’s game.”
And to throw down the gauntlet against some the current negative talk in the markets, Mr. Buffett boldly predicted something quite extraordinary – which was that in 100 years “the Dow will be over a million.”
Is that even remotely believable, or is Mr. Buffett getting carried away by his own optimism?
The Challenge By Buffett: Check The Math
Warren Buffett knew as he predicted Dow One Million that this would seem unbelievable to many people or even ridiculous. Which is why he also said this “is not a ridiculous forecast at all if you do the math”.
In this analysis we will do that math using two key assumptions.
First we will use an absolutely average historical rate of inflation.
We will also take a look at the Dow Jones Industrial Average in the same terms that Mr. Buffett was talking about – which is price changes in an index (but not including dividends). In the process we’re going to learn some valuable lessons with a great deal of real-world applicability not just going out 100 years, but also for the next 10, 20 and 30 years when it comes to retirement financial planning and other forms of long-term investment.
A Historically Normal Rate Of Inflation, Past And Future
We will begin by determining the long-term rate of inflation. For this we will go back to 1933 and the end of the gold standard for domestic purposes. The consumer price index for urban consumers, which is usually referred to as the CPI-U, was 13.2 in August of 1933.
Exactly 84 years later in August of 2017, the CPI-U was up to 245.5. Now there’s several different ways of looking at this. One way is what would have cost us $13.20 in 1933, instead costs over $245 dollars in 2017, meaning that we are paying almost 19 times as much for the basic goods and services of daily life in 2017 than we did in 1933.
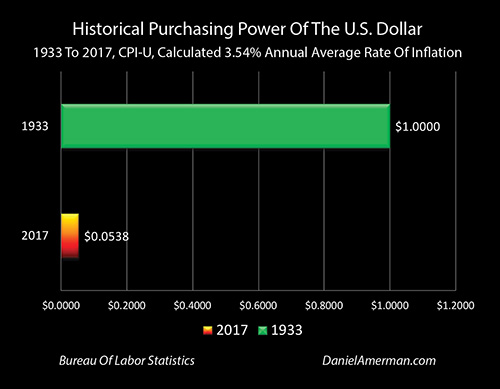
Another way of looking at this is as shown above, which is to say that the purchasing power of the dollar has dropped from one dollar in 1933 to a little over five cents in 2017.
And when we do the math, dropping from a dollar to little over 5 cents in 84 years works out to an average annual rate of inflation of 3.54%.
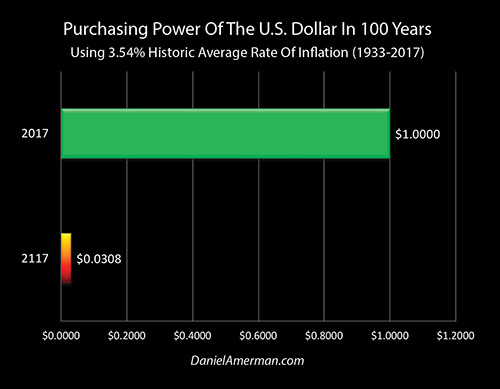
If we take that same exact rate of inflation of 3.54% and project it forward for 100 years – to match Mr. Buffett’s prediction – then we expect that the dollar will have a purchasing power of a little over three cents.
This is a good bit lower than the reduction to five cents that we experienced between 1933 and 2017, but we’re going out 100 years instead of 84 years and that makes a big difference.
No one can say for sure, but if we accept that a good source for a guess at the long-term future is to assume that the long-term past repeats itself (which is quite questionable, but that is the norm in finance and economics) then a purchasing power for the dollar of a little over three cents in the year 2117 could be called a reasonable guesstimate.
The Components Of Dow 1,000,000
So if we start with Dow 1,000,000 and we adjust for historically average inflation, then Dow $1,000,000 would have a purchasing power in today’s terms of Dow’s $30,845. (The index is not actually expressed in dollar terms, but it will be easier to follow in the examples herein if we use dollars in certain places – as if someone were literally spending $22,413 to buy the Dow index).
As of September 20th, 2017, the close in the Dow was 22,413.
So that would then imply that we have total real profits adjusting for inflation of only $8,432 over 100 years ($30,845 – $22,413 = $8,432).
That is only a 38 percent profit in real terms – in what our money would buy for us – over an entire century. How can that possibly be?
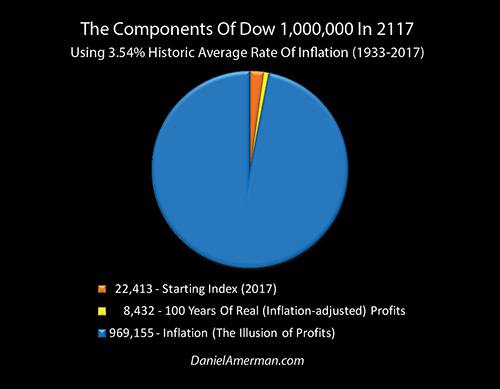
The startling answer can be seen in the graph above which breaks Dow 1,000,000 in 100 years out into its individual components.
The first thing that we see is the thin orange slice of 22,413 which is the starting value for the Dow Jones Industrial Average. The yellow slice which is even thinner still is the 8,432 which represents 100 years of real inflation-adjusted profits.
The entire rest of the pie graph, the entire remaining amount of Dow 1,000,000 is 969,155 in inflation. It’s the dollar going from being worth a dollar to dollar being worth three cents (1,000,000 X (1 – .0308) = 969,155)
So Mr. Buffett predicting Dow 1,000,000 in 100 years is not in any way a remarkable and fantastic leap of optimism. He was right to say to check the math and once we do check the math – we can see that this is not an aggressive forecast at all.
Indeed if we experience historically average rates of inflation in the future, then Dow 1,000,000 in 100 years is a remarkably cautious prediction, and could even be called a very pessimistic prediction.
It means that for the entire next century there would be hardly any real profits in the entire stock market in inflation-adjusted terms.
When we run the numbers, for the Dow to go from 22,413 up to an inflation-adjusted 30,845 in 100 years would mean a 0.32% real (inflation-adjusted) rate of return on an annual basis, or a return of just over 3/10 of 1%.
And the source of confusion here, for how what is actually a very pessimistic projection can be seen as ridiculously optimistic – is that few people really take into account what an average rate of inflation does over time. Mr. Buffett gets that math, but he also knows that most don’t.
Dow One Million and the pie graph above may seem outlandish or exaggerated, but all it really shows is what happens if the completely normal just continues to repeat itself – over a long enough period of time.


Leave A Comment