
Producer Price Inflation – PPI Final Demand
The breakeven inflation rate and treasury yields have increased every year over year since hourly earnings growth hit a cycle high. The August PPI report missed expectations widely, signaling inflation isn’t a threat at all.
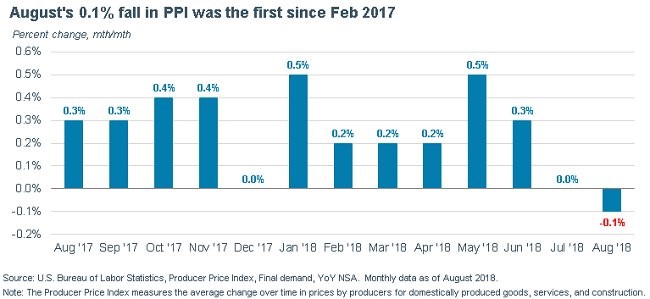
As you can see in the chart below, month over month PPI was down 0.1%. This was the first decline since February 2017. It missed expectations for 0.2% and was below last month’s flat reading. Year over year PPI was up 2.8% which fell from July’s 3.3% growth rate.
Excluding food and energy, month over month inflation fell 0.1% and year over year inflation was up 2.3%.
Month over month inflation was expected to be up 0.2% and the lowest estimate was for 0.1% growth. July inflation was up 0.1%. July’s year over year rate was 2.7%.
You can see trade services played a role in the weakness. Excluding it, inflation was up 0.1% month over month and 2.9% year over year. Month over month inflation missed estimates by 0.1% and missed July’s reading by 0.2%.
Producer Price Inflation –
Year over year inflation was actually up 0.1% from July.
The moribund inflation at the base of the supply chain is much different from wage inflation. That’s good news for real wage growth.
Food prices fell 0.6% and energy prices were up 0.4%. As I mentioned earlier, trade service prices were weak. They fell 0.9% after falling 0.8% in July.
Year over year, prices were only up 0.8%. Construction prices were up 0.1%. Car prices were up 0.7%, but light truck prices were down 0.1%. Personal consumption inflation was flat, which signals PCE inflation will be low.
The industries impacted by tariffs were affected by inflation as steel mill products were up 2.6% month over month and 18.6% year over year. Aluminum prices were down 2.1% month over month and up 14% year over year.
Finally, fabricated metals prices were up 2.2% month over month and 15.7% year over year.


Leave A Comment