
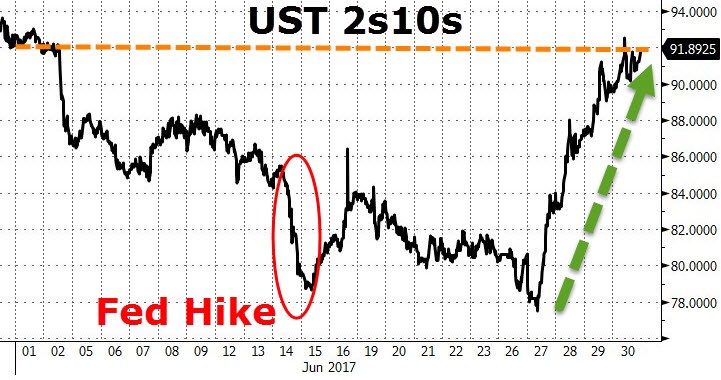
With the end of the first half of the year in the books, we’re seeing an interesting divergence between the recent trading and the total results for the past 6 months. The Nasdaq had its best first half since 2009 as it was up 14.1%. At the same time, it also had a rough June as it broke a 7-month winning streak having its worst month since October. In the same token, the yield curve had been flattening this year, but in the past four days it has steepened to the rate it was at when June started as you can see in the chart below. There’s been a large selloff in the 10-year bond as yields increased from 2.137% to 2.2966% in the past four days.
There’s a few reasons for this recent move in bonds. Firstly, it’s a correction from the overbought levels in long bonds which caused the flattening of the yield curve to nearly breach the levels seen in 2016. Another thing to keep in mind was the positive surprise seen in Q1 GDP. The 1.4% growth rate is double the first reading which might mean bond investors realized they got too negative on U.S. growth. Remember, investors buy the long bond as a play on weak growth. Keeping with the theme of investors reversing some of the intermediate term trends, oil prices have increased about $3 to $46.15. With higher oil prices, inflation expectations increase and so do bond yields. Finally, there was a selloff in long European bonds. This selling bled into the American bond market. This selloff was in response to Draghi’s anticipated tapering. I’ve been on both sides of the coin with Draghi and so has the market. I can see the market changing its reaction back and forth until the final decision comes out in October.
Unlike the Bloomberg Consumer Comfort index, the University of Michigan’s consumer confidence showed weakness. While the indexes had different overall numbers, both saw their expectations index fall and current index rise. As you can see from the chart below, the Current Conditions index increased from 111.7 to 112.5 which is an increase of 0.7% month over month. The expectations index fell 4.3% month over month, pushing the overall index down 2.1% month over month (it was still up 1.7% year over year). This divergence doesn’t mean much. If you look at the long-term charts of both indexes, they seem to crash right before recessions. Neither metric leads the other. However, the current conditions index is higher than the expectations index relative to their historical past making the divergence not a new trend.


Leave A Comment