
There were two record-breaking silver factors in 2015 that could turn out to be quite an interesting development for 2016. The figures that make up these separate factors don’t seem so striking until we combine them and study at the trends.
This is what I enjoy doing the most. Why? Because I can see interesting developments that aren’t readily apparent when we look at the figures or data individually. By combing this data, we can spot noteworthy trends that would likely set up the market for stunning price movements in silver.
For example, 2015 turned out to be a record year for total U.S. and Indian silver imports. Combined U.S. & Indian silver imports didn’t just surpass the previous record set in 2014… IT SMASHED IT by 20%:
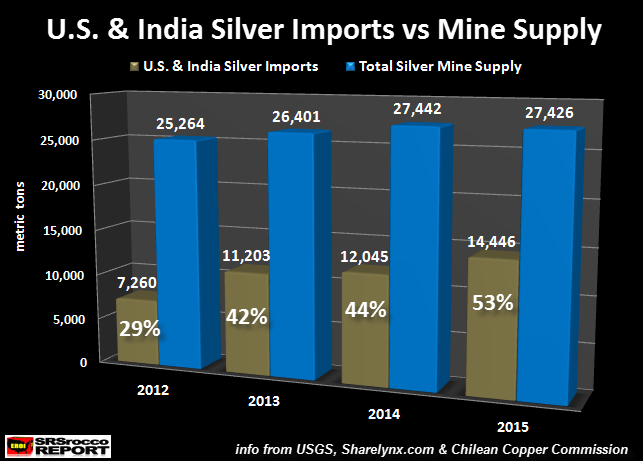
As we can see, U.S. and Indian silver imports surged to 14,446 metric tons (mt) in 2015, up 20% from 12,045 mt in 2014. This turns out to be a cool 464 million oz (Moz) of silver. Furthermore, the combined silver imports of these two countries accounted for 53% of total global mine supply. Thus the percentage of U.S. and Indian silver imports versus global mine supply continues to grow from 29% in 2012.
Note: While it’s confusing to some readers to see figures stated in metric tons and troy ounces, that is due to the way it’s reported by the industry. I could convert everything to one standard, say metric tons, but this wouldn’t help because many official sources report data in troy ounces. So, the reader just has to get used to making the conversion by using the following: (1 metric ton = 32,150 oz).
Investors need to realize that the U.S. and India importing 53% of total mine supply is a significant figure. I would imagine India is importing a lot of silver not only because of it’s an excellent investment at the low $15 price, but due to their huge demand for future solar installations.
India Plans To Get Stupid With Massive New Solar Installations


Leave A Comment