Following the records set in the first week of October 2017, the S&P 500 (Index: SPX) continued to mark new highs during the second week of the month.
More specifically, the 2555.24 that marked the level of the S&P 500 at the close of trading on Wednesday, 11 October 2017 upped the ante for the index’s series of new high closing values, although it wasn’t much of a gain over the previous week’s closing value of 2549.33 on Friday, 6 October 2017. Nor was it far below the S&P 500’s all-time intraday high of 2557.56 that the index reached at 10:46 AM EDT a week later on Friday, 13 October 2017, before slipping back to end the week at 2553.17.

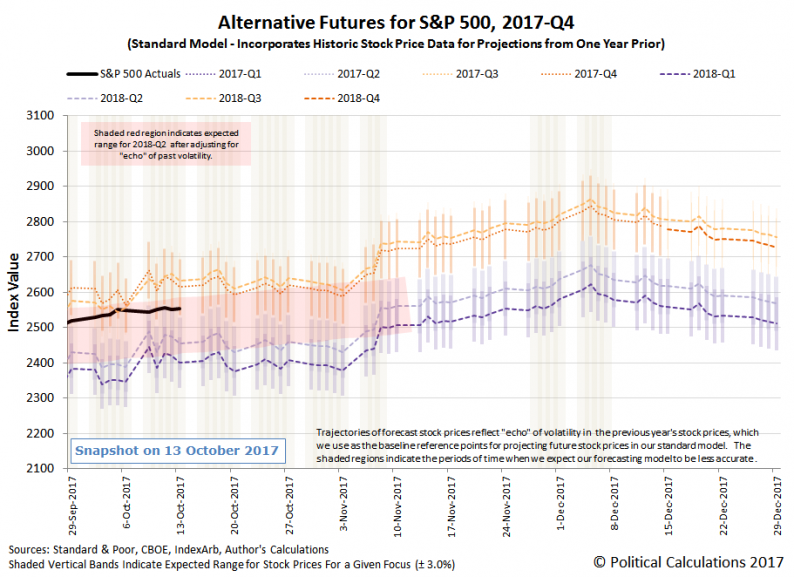
The S&P 500 continues to track along near the upper end of the echo effect-adjusted range that we first forecast back in the first week of September 2017. At that time, we observed that investors were largely focusing on 2018-Q2 as they considered the future for the S&P 500, where we constructed our forecast based on the assumption that they would largely continue focusing on that distant future quarter over the next two months.
As things stand today, we’re now past the halfway point, with just three and a half weeks to go before we reach the end of our need to account for the echo of past volatility in stock prices in our dividend futures-based model of how stock prices work.
Through Week 2 of October 2017, there was nothing to really prompt investors to shift their focus toward a different point of time in the future, which can be seen in the headlines that we flagged during the week.
Monday, 9 October 2017
Tuesday, 10 October 2017


Leave A Comment